
Homologous flares are the solar equivalent of identical twins. They concern a series of solar flares repeating in the same active region with essentially the same position and with a common pattern of development, i.e. having the same main footpoints and general shape in the main phase as defined in H-alpha or EUV-imagery. Though not a requirement, homologous flares often have similar strength, and if there are more than two, they sometimes occur within similar time intervals. Some examples are discussed in this STCE Newsitem.
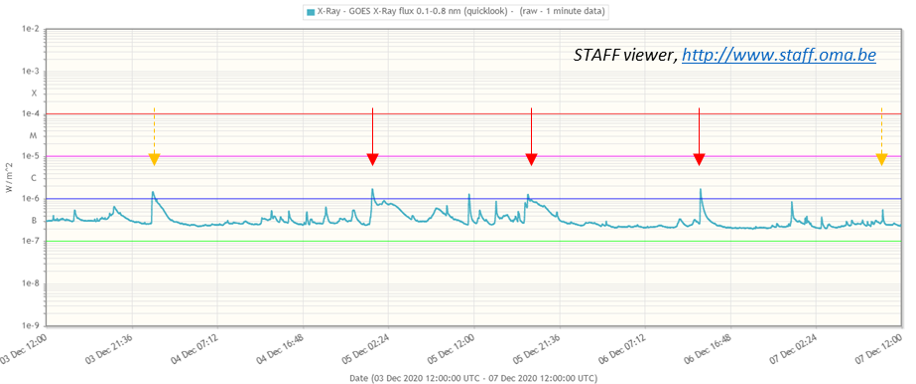
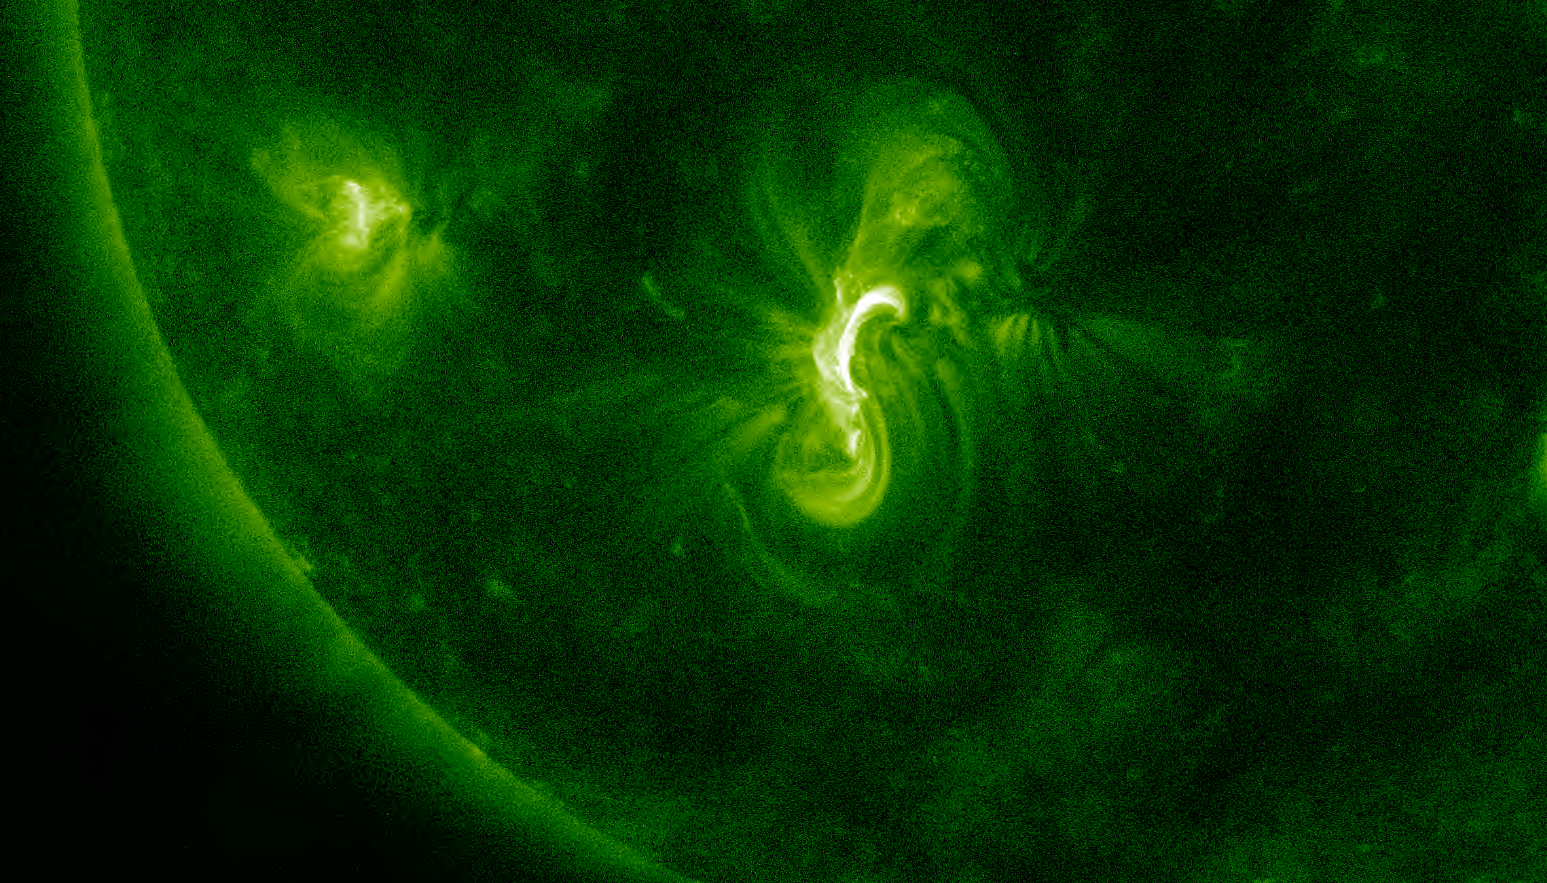
NOAA 2790, responsible for last week's M4 event, was all-in-all a relatively simple active region consisting mainly of a single symmetric sunpot. It produced several low-level C-class flares such as e.g. on 5 and 6 December as indicated by the red arrows. These flares were of similar strength (resp. C1.6, C1.2 and C1.6) and happening at intervals around 18 hours between each other. More importantly, extreme ultraviolet (EUV) imagery by SDO revealed an almost identical flare outlook, i.e. a stretched S-shape with a significant brighter northern portion and a somewhat fuzzy area just north of the active region.
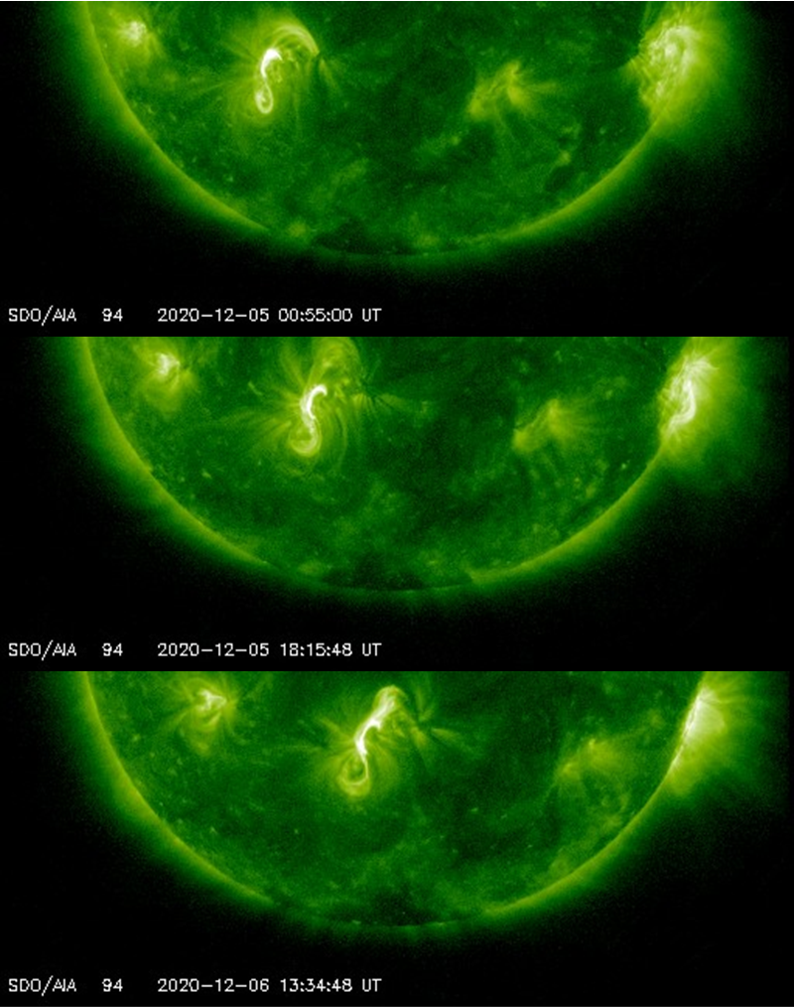
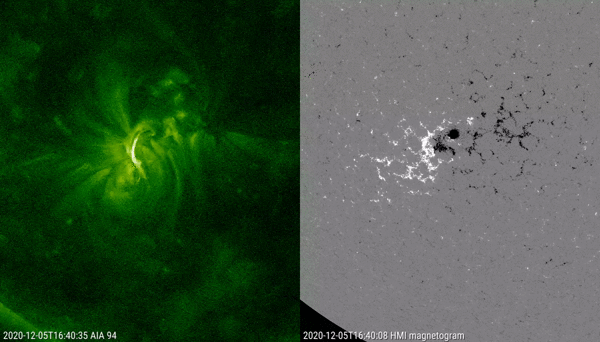
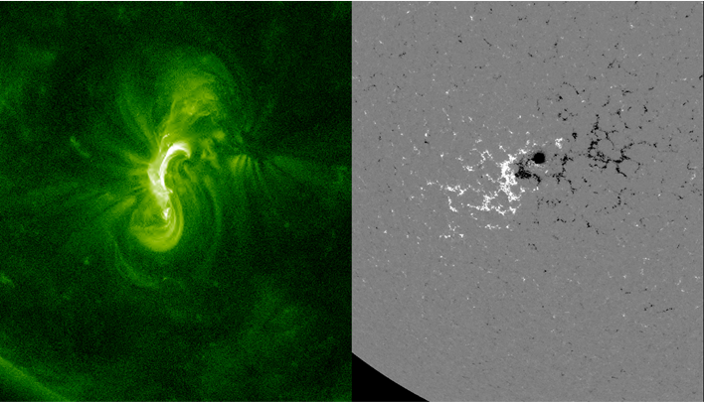
The 3 homologous flares were preceded by a C1.4 flare peaking a day earlier and followed by a B5.4 flare 20 hours later (indicated by the dashed orange arrows). However these flares are not really considered to belong to the "family". The first flare clearly lacked the well-defined southern portion of the S-shape, whereas the last flare was much weaker with only the middle portion somewhat lighting up. The imagery underneath from flare number 3 (the one peaking on 5 December at 18:06UTC) indicates that the flaring took place along the magnetic inversion line, i.e. the line separating positive (white) and negative (black) magnetic polarities in the active region (right). The magnetic configuration in NOAA 2790 seems to have been stable enough to allow for the three nearly identical flares on 5-6 December. The difference in the x-ray flux outlook of flare number 4 (fast decrease) compared to numbers 2 and 3 (slow decrease) suggested that this magnetic configuration was breaking up. Of course this doesn't mean the active region can't produce any flares anymore, they will just be different in outlook and/or strength.
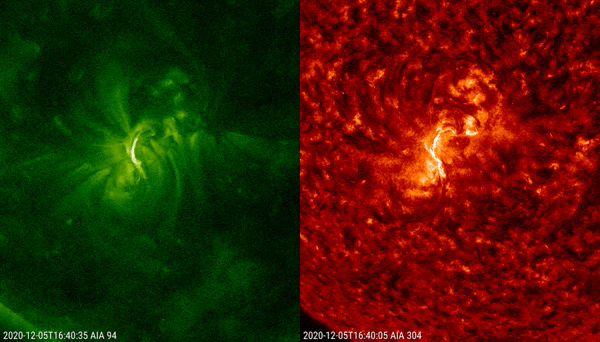
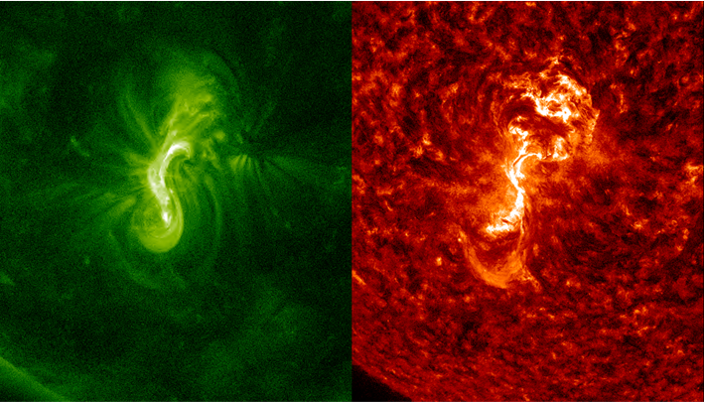
Comparing the flaring events in different wavelengths highlights subtle differences. Underneath SDO-imagery compares the outlook of flare number 3 in AIA 094 at several million degrees (left) with that in the AIA 304 filter at temperatures around 80.000 degrees (right). Some of the differences are mainly due to temperature differences in the various flare structures, making them invisible in one filter or the other. An example is the "hot" big southern loop which is not visible in the "cold" AIA 304 images. Despite the quite dynamical character of the flaring events, none of them were associated with a coronal mass ejection.
