
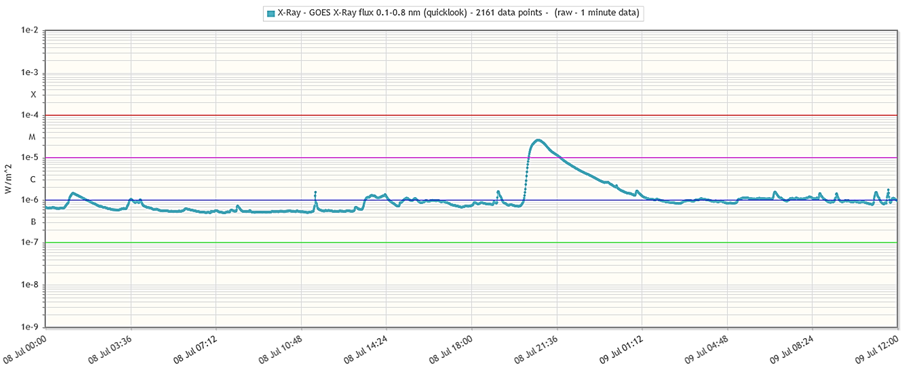
NOAA 3053 rounded the Sun's northeast limb on 4 July and produced an M2.5 flare late on 8 July. This was a long duration event (LDE) that started at 20:07UTC, peaked at 20:49UTC, and ended at 21:28UTC, as recorded by GOES. Using the ROB's STAFF tool, a graph with the evolution of the GOES soft x-ray flux was created for the period from 08 July at midnight until the next day at noon. The eruptive event clearly stands out. LDEs are usually associated with a coronal mass ejection (CME). Such was the case here, but the bulk of the CME was directed away from the Earth.
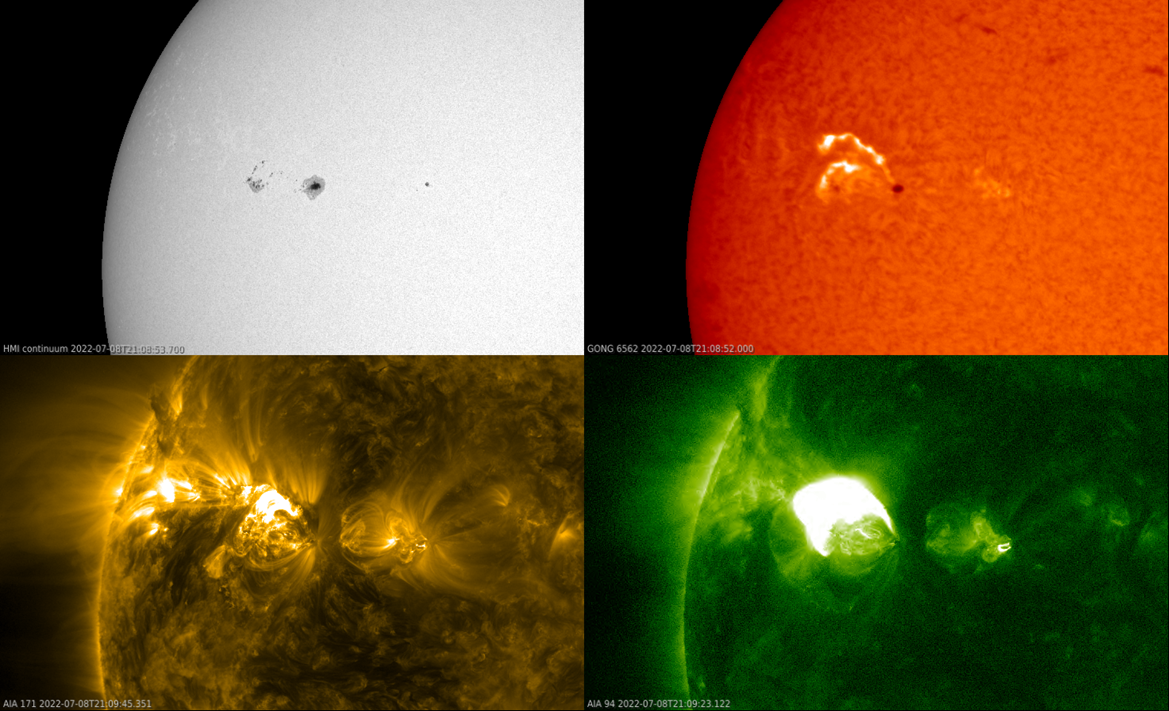
Using Space Weather HelioViewer (SWHV), a mosaic was created showing the eruption at various wavelengths and running from 18:30 till 01:30UTC. This can be seen in the imagery underneath (around 21:09UTC). In the upper left is a white light image (SDO/HMI), showing the source region as a relatively open group with a well-sized asymmetric leading sunspot and a smaller but more complex trailing portion. This M2.5 solar flare was not visible in white light, an honor that is (usually) only reserved for the strongest flares. H-alpha images (upper right) show that the flare took place slightly north of this region around a filament. Solar filaments are clouds of charged particles ("plasma") above the solar surface squeezed between magnetic regions of opposite polarity. These magnetic fields may become unstable causing the filament to fully/partially erupt, with the possibility for the filament to reform after the eruption. H-alpha images show the Sun in the red portion of the visible spectrum near 656.3 nm, offering a glimpse of the chromosphere, a thin layer layer between the Sun's photosphere ("solar surface") and the corona, its hot outer atmosphere. Two parallel ribbons can be seen forming on each side where the filament was located, a tell-tale sign a flare has taken place. The H-alpha images were taken from the GONG network, a series of 6 similar observing stations distributed at regular intervals around the globe. This explains the somewhat "bumpy" images in the animation. The two lower images show the Sun in extreme ultraviolet and were taken by SDO/AIA. The lower left was made using the AIA 171 filter, showing the Sun at a temperature near 700.000 degrees. It shows the development of the post-flare coronal loops, with the animation also showing the ejection of some material (CME). The lower right imagery is from the AIA 094 filter, showing the Sun at a temperature of several million degrees, and thus showing the hottest portions of the solar flare. Note the colors are not real but artificially added to distinguish between the various wavelengths.
