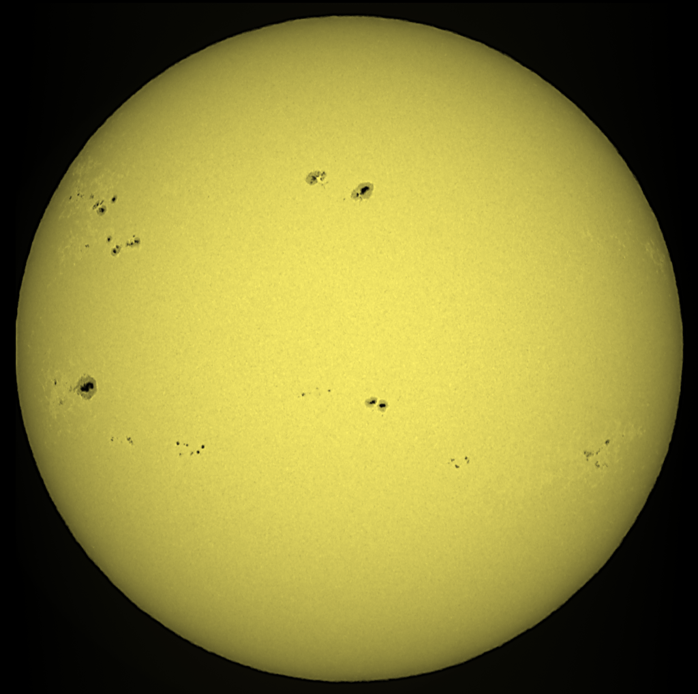
January continued the high levels of solar activity. So far this month, already a few dozen of M-class flares have been recorded as well as 3 X-class flares, the most recent one an X1.0 event that took place on 10 January (see the related STCE newsitem). The solar disk was peppered with big and small sunspots, as can be seen in the white-light image underneath taken on 15 January by the solar telescopes of the Royal Observatory in Belgium (USET). The image has been colourized and contrast enhanced. Using eclipse glasses, the big spot in the lower left has become visible to the naked eye. This will remain so for the next few days as the sunspot remains close to the Sun's central meridian ("north-south" line).
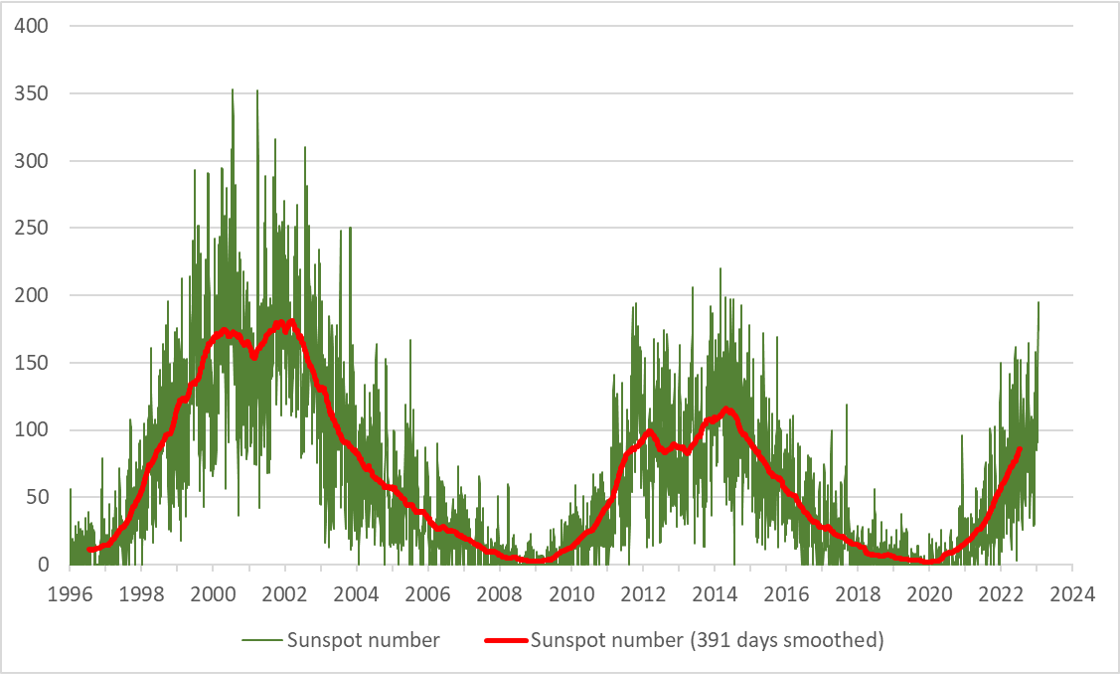
The sunspot number, as determined by SILSO, was the highest so far this solar cycle (SC25) and reached values not seen since the previous solar cycle maximum. The estimated daily sunspot number, i.e. the sunspot number calculated from a limited number of observations received for that day, was near 195 (+/- 20) on both 15 and 16 January. Note the estimated sunspot numbers may differ somewhat from the provisional values that are issued in the beginning of the subsequent month, when many more observations are available. These provisional numbers differ very little from the final values that are usually published 3 to 6 months later. The graph underneath displays these 3 types of daily sunspot numbers, with the final values running from January 1996 till June 2022, the provisional ones from July till December 2022, and the estimated sunspot numbers from 1 till 17 January 2023. The red line is a smoothing average over 391 days, a duration corresponding loosely to the 13-months smoothing formula that is used for monthly sunspot numbers.
The currently recorded sunspot numbers (just below 200) are similar to the ones recorded during the double maxima of the previous solar cycle in 2011 and 2014. It is however quite sobering to compare these values with the sunspot numbers of the "moderate" solar cycle 23, during which there were over 340 days when the daily sunspot number was at or exceeded 200. There were even 15 days when the sunspot number was higher than 300! Clearly still a gear or two higher than what we are currently observing in the ongoing solar cycle...
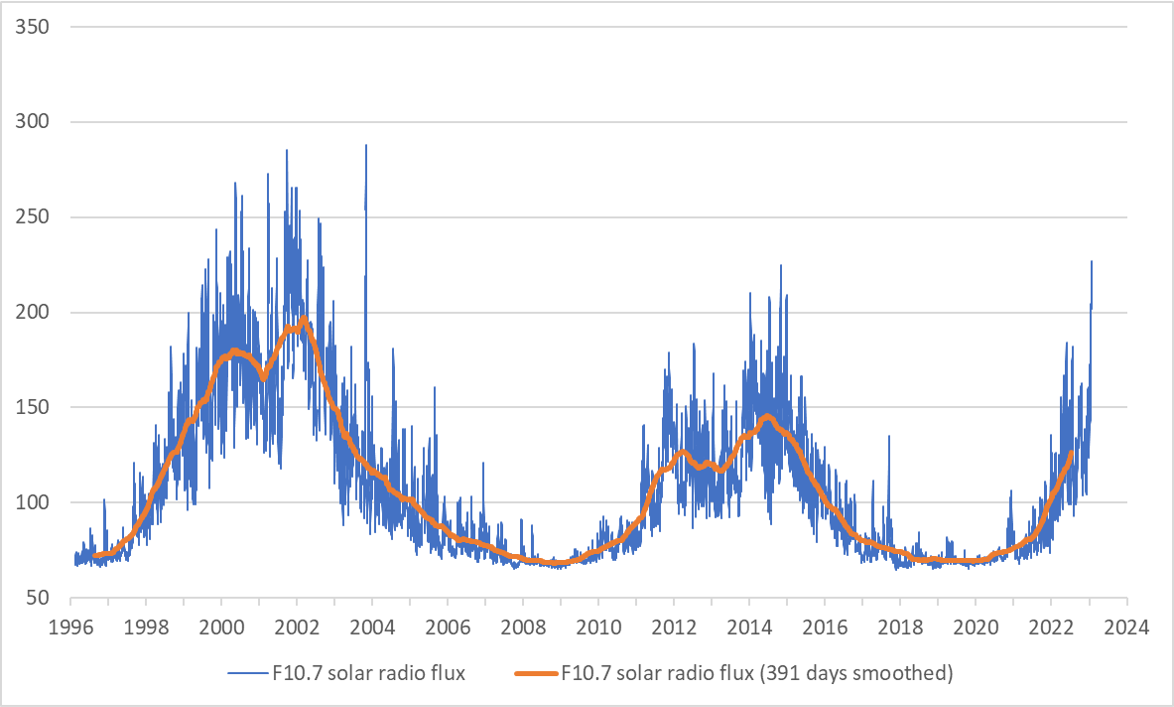
The high solar activity was also reflected in the 10.7 cm solar radio flux (F10.7), data which can be found on the website of the Natural Resources Canada/Solar radio flux Penticton. In the graph underneath, "adjusted" radio fluxes have been used to scale the observed values all to the same Sun-Earth distance of 1 Astronomical Unit (about 149.6 million km). Indeed, due to the varying Sun-Earth distance throughout the year, the observed radio fluxes would be about 3% lower during June-July when the Earth is furthest away from the Sun, and about 3% higher during the December-January timeframe when our planet is closest to the Sun. This correction allows for a comparison of the radio fluxes on an equal footing over the various solar cycles. The orange curve reflects the smoothing average again over 391 days. The data were also corrected for the most obvious effects of solar flaring, by eliminating about two dozen of affected daily values.
The conclusions are very similar as for the sunspot number. The values recorded during the first half of January 2023 are the highest so far this solar cycle, with 226.7 solar flux units for the adjusted radio flux (observed: 234.3 sfu) on 15 January. These values are comparable to the maximum of the previous solar cycle in 2014, but -for the moment- well below what was recorded during solar cycle 23. During that solar cycle, the solar flux exceeded the threshold of 250 solar flux units (sfu) on 38 days. With the radio flux considered a proxy for the enhanced solar extreme ultraviolet radiation, the (observed) value of 250 sfu is thought to be a threshold above which the first drag effects from the expanding Earth's upper atmosphere manifest themselves on satellites in a Low Earth Orbit (LEO), thus lowering their altitude. On the positive side, these drag effects also help in cleaning up the space junk from e.g. satellite launches (nuts, bolts, fairings, nose cones,...) and other space debris. See the STCE newsitems at https://www.stce.be/news/452/welcome.html and https://www.stce.be/news/201/welcome.html The current evolution in solar activity leaves little doubt that the daily sunspot number will exceed 200 and the solar radio flux 250 sfu at some point this solar cycle.