
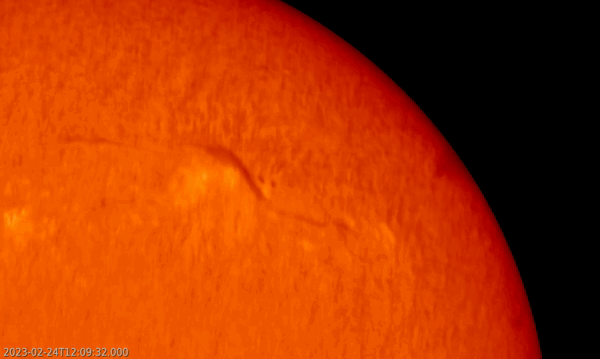
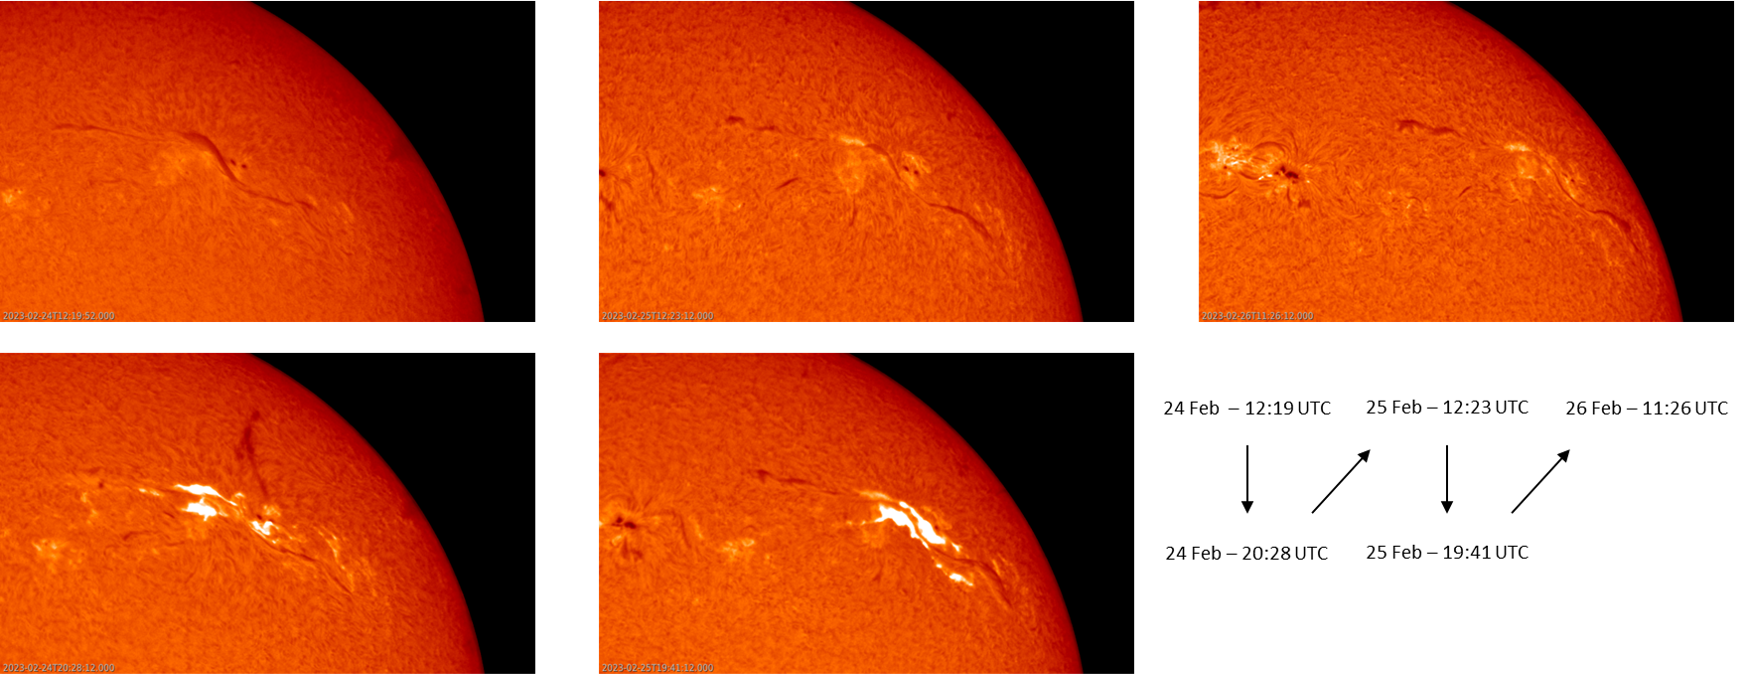
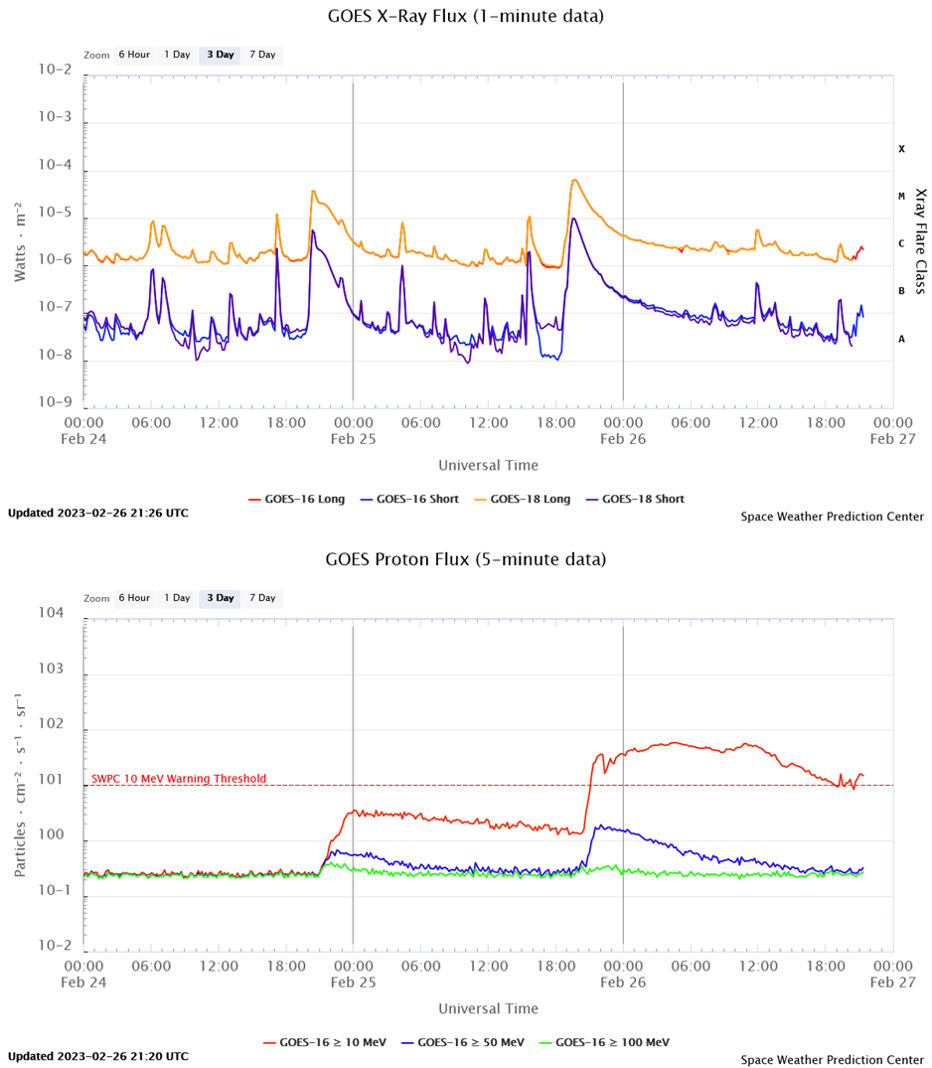
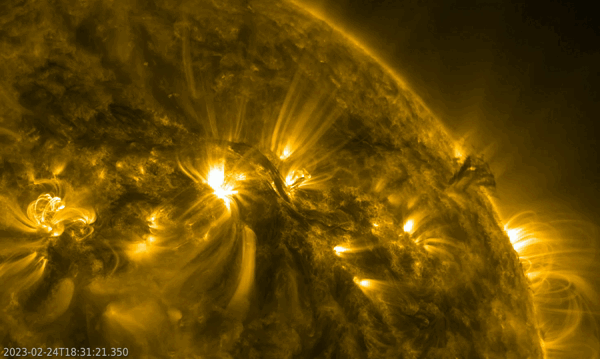
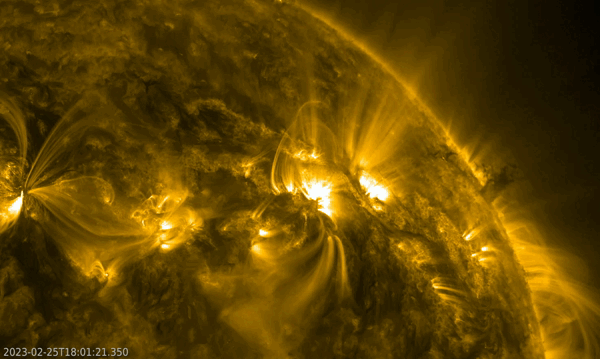
Sunspot group NOAA 13229, source of an X-class event on 17 February (see last week's STCE newsitem), was decaying when it produced an M3.7 and an M6.3 flare (GOES soft x-ray) on respectively 24 and 25 February. The imagery underneath was obtained with the H-alpha network from GONG showing the presence of a long filament with the middle portion intersecting active region (AR) 13229 north to south. Only a few sunspots were remaining, the two largest can be seen to the northwest (upper right) of the filament. The H-alpha compilation shows the area around noon on 24, 25 and 26 February (top row) and during the eruption 6 to 8 hours later on the first 2 days (bottom row). In both events, it is clear that it is always the middle portion of the filament that erupts, but also that it re-establishes itself each time after the eruption. The optical class for the flares was respectively 2B and 3N, meaning that in H-alpha the M6 flare ribbons had a larger area (as is evident in the imagery), but also a bit less intense (N is for "Normal" intensity, and B is for "Bright" - see the STCE SWx classification page) than the flare ribbons associated with the M3 flare.
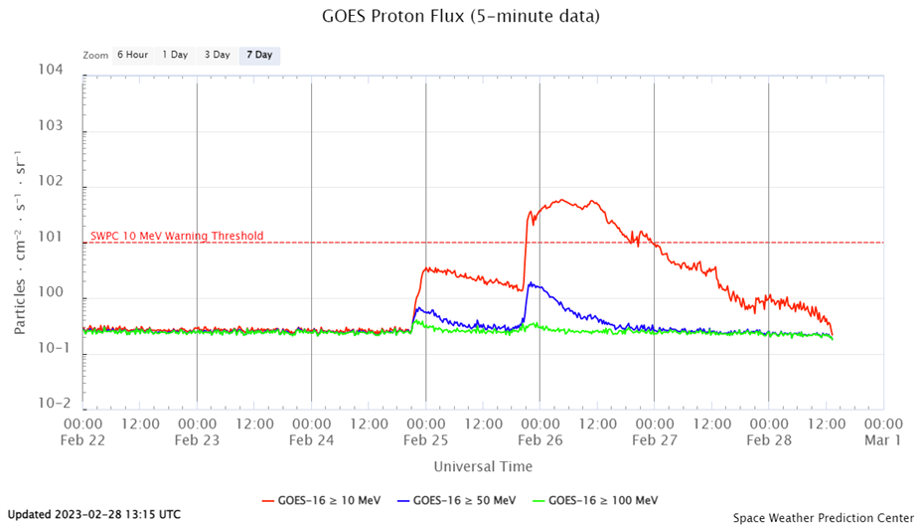
The M3 flare was associated with a mild enhancement of the greater than 10 MeV proton flux, reaching 3 pfu on 25 February at 00:45 UTC. The M6 flare was associated with a genuine proton event, starting on 25 February at 21:10 UTC and reaching a peak of 58 pfu on 26 February at 04:40 UTC (see the graph underneath ; compilation). This was the first proton event of 2023, and the strongest so far this solar cycle. These protons get deflected by the Earth's magnetic field towards the poles, where they can degrade High Frequency (HF) communications, also known as Polar Cap Absorption (PCA). For the 26 February proton event, PECASUS issued HF COM advisories to the international civil aviation (ICAO). The flux of the more energetic protons (100 MeV or more) barely showed an increase and remained at background levels. As a result, no ground level enhancement (GLE) was observed. Note that a weaker proton event (29 pfu) on 29 October 2021 was associated with a significant increase in the 100 MeV proton flux, thus resulting in a weak GLE, the only one so far in SC25 (see the STCE newsflash).
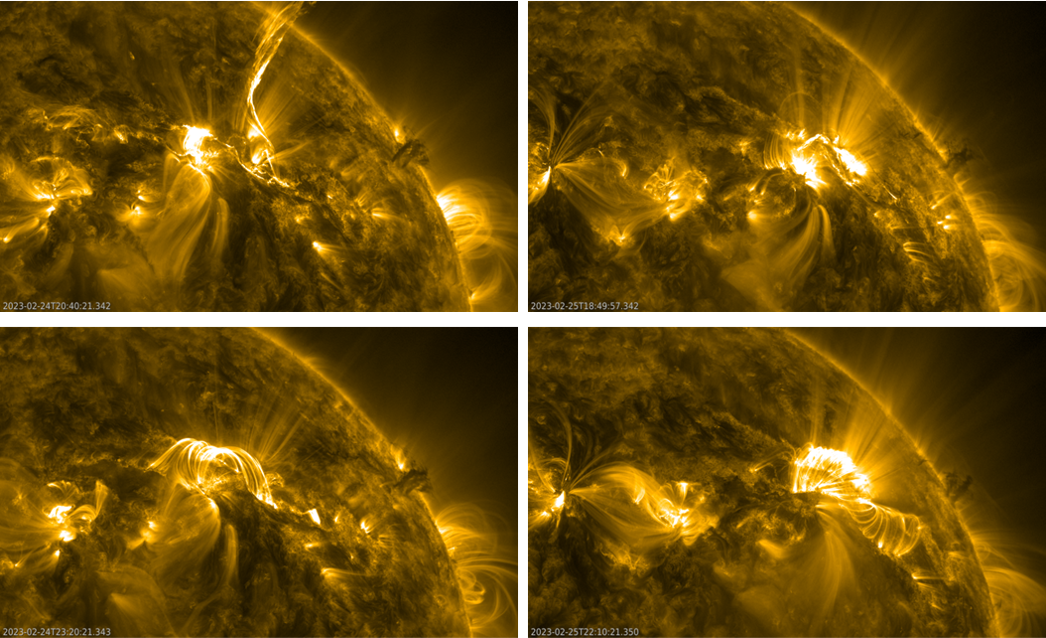
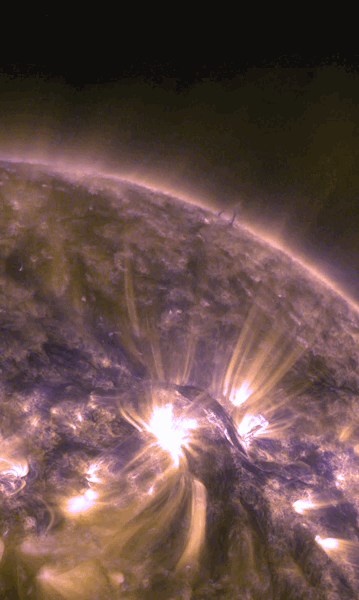
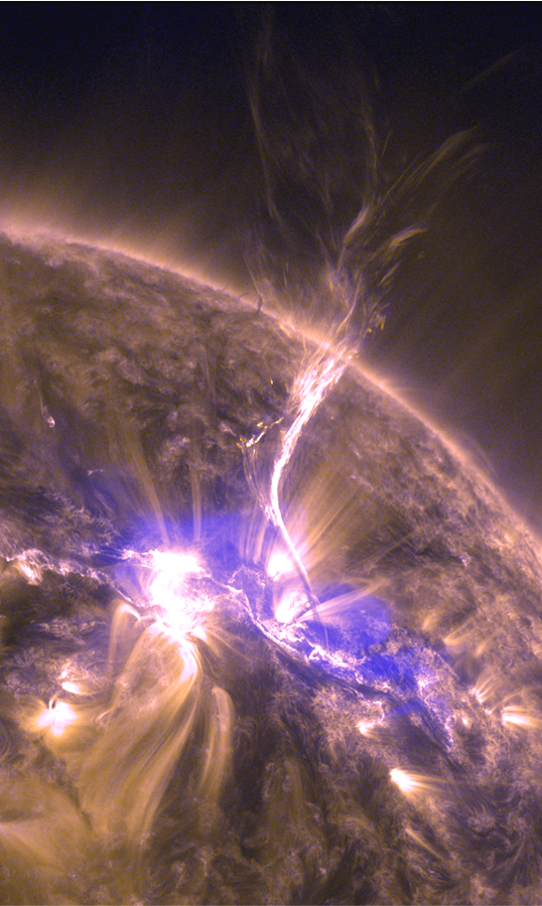
Both flares peaked in the evening, resp. at 20:30 UTC and 19:44 UTC, and were also long duration events (LDE) lasting resp. 86 and 107 minutes. HF communications may have been disturbed mainly over the Pacific, Central-America, and the western portion of South-America. In extreme ultraviolet (EUV) SDO/AIA 171 imagery underneath, showing the solar atmosphere at temperatures around 700.000 degrees, the filament can clearly be seen ejected resp. towards the north and the west (upper row), with the arcade (series of post-eruption coronal loops) clearly much longer following the M6 flare (lower row). The main clip spans 48 hours at a cadence of 1 image per 10 minutes, with 2 smaller clips (M3, M6) focusing on the eruption having a 1 minute cadence. From these images, it is clear that the first eruption is visually more impressive than the second one. Imagery of that first M-class eruption is underneath and combines AIA171 (yellowish) with AIA131 imagery, the latter allowing a better contrast between the cold (dark purple) and hot (sky blue) areas of the eruption.

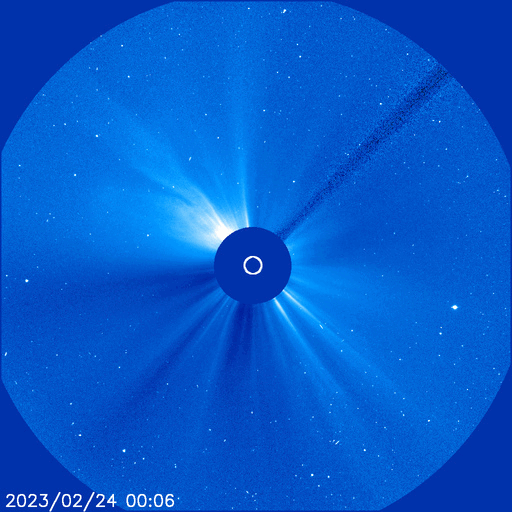
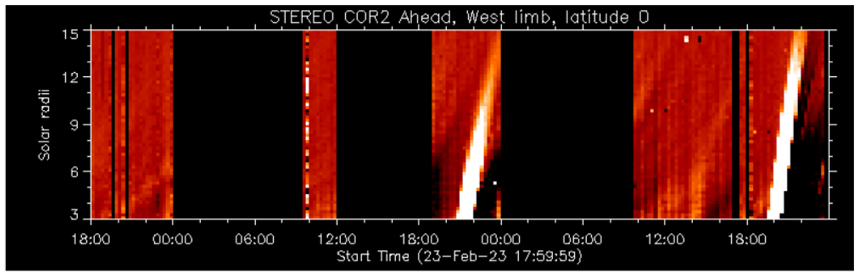
Due to the timing of the flares, the daily solar radio flux as measured in Penticton (BC, Canada) at 20 UTC was affected, in particular on 26 February when it reached a value of 279 sfu, which was well above its usual daily values around 150-160 sfu. Both events were thus also Tenflares, being resp. 230 and 500 sfu above the pre-event values of the 10.7cm radio flux. Enhanced radio emissions were also observed at other wavelengths including GNSS (RSTN ; NOAA/SWPC event reports). Radio observations of the two flaring events indicated they were both associated with Type II radio bursts, thus indicating the eruptions were associated with a coronal mass ejection (CME). Coronagraphic observations by SOHO/LASCO indicated two fast halo CMEs with an earth-directed component. The LASCO C2 imagery underneath shows both CMEs, with an earlier CME directed to the northeast believed to be a farside event. Analysis of STEREO-A time-distance plots gave projected (plane-of-the-sky) speeds of resp. 950 and 1150 km/s (plot).
Space weather forecasters at the SIDC predicted the arrival of the CMEs resp. for late on 26 February and the evening of 27 February. These proved to be fairly accurate predictions. A shock in the solar wind speed from the first CME was observed on 26 February at 18:43 UTC with solar wind speed jumping from around 470 km/s to around 540 km/s. The arrival of the second CME was a bit less clear in part due to data problems with DSCOVR. The current consensus is that the second CME most likely arrived around 10:20 UTC on 27 February (marked again by an uptick in the magnetic field strength to 20 nT - see annotated image), and was quickly followed by the high speed stream of the coronal hole. Solar wind speed reached values near 840 km/s, the highest so far this solar cycle. It has been since the September 2017 solar activity that a passing CME was involved in such elevated near-Earth solar wind speeds.
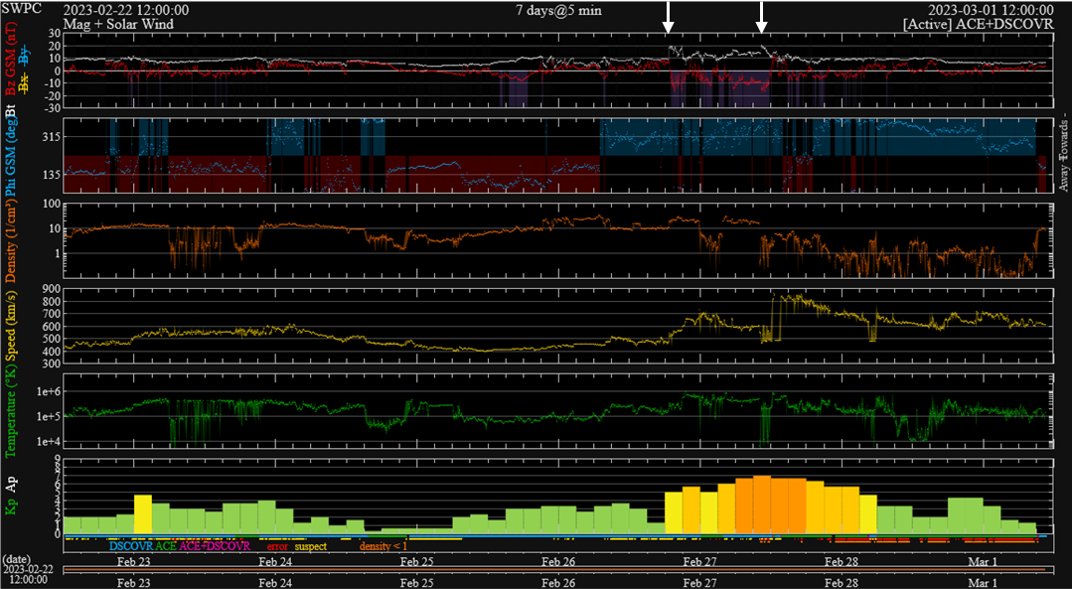
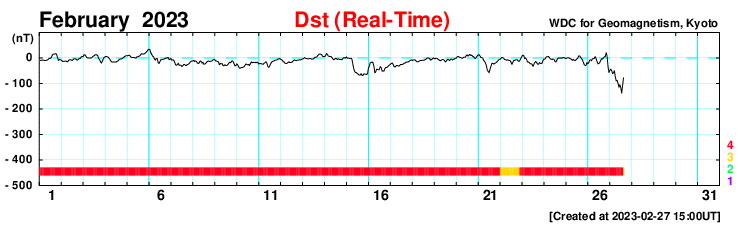
This one-two punch by the passing CMEs resulted in a strong geomagnetic storm with the preliminary planetary K index (Kp) reaching 7 (see the graph above) and the Disturbance storm-time index -138 nT (Dst ; graph ; see also the STCE's SWx classification page). Dst-wise, this is the strongest geomagnetic storm of the current solar cycle so far, dethroning the 4 November 2021 storm when Dst reached -105 nT. Compared to storms from the entire previous solar cycle, it would still rank quite high - See this STCE newsitem for an overview of the strongest geomagnetic storms during SC24. An obvious result from all this geomagnetic activity were the polar lights, photographed as far south as Colorado and Missouri (USA), France, Belgium, Saxony (Germany), Slovakia and New Zealand - See the aurora page at https://www.spaceweather.com/ Many observers lauded the vivid red colours of these polar lights.
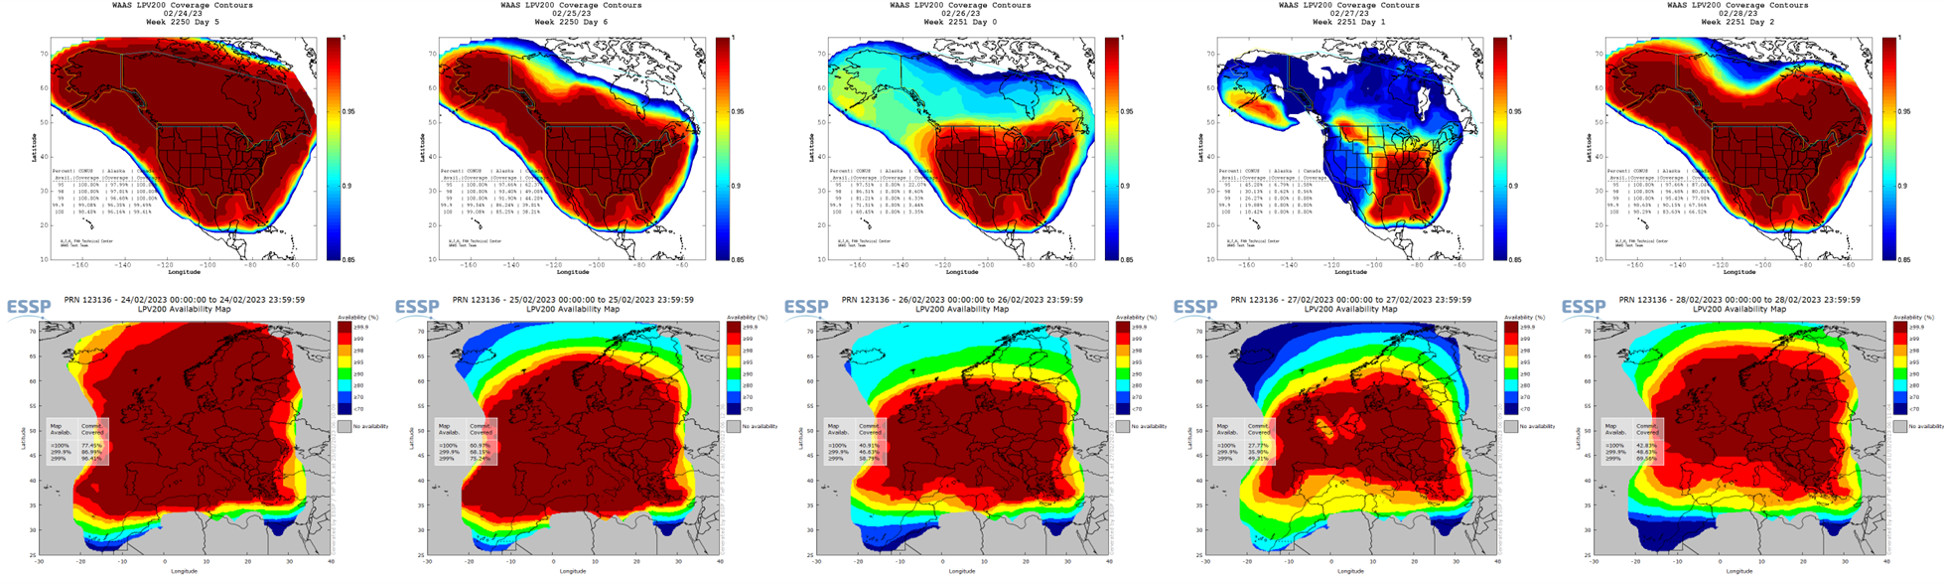
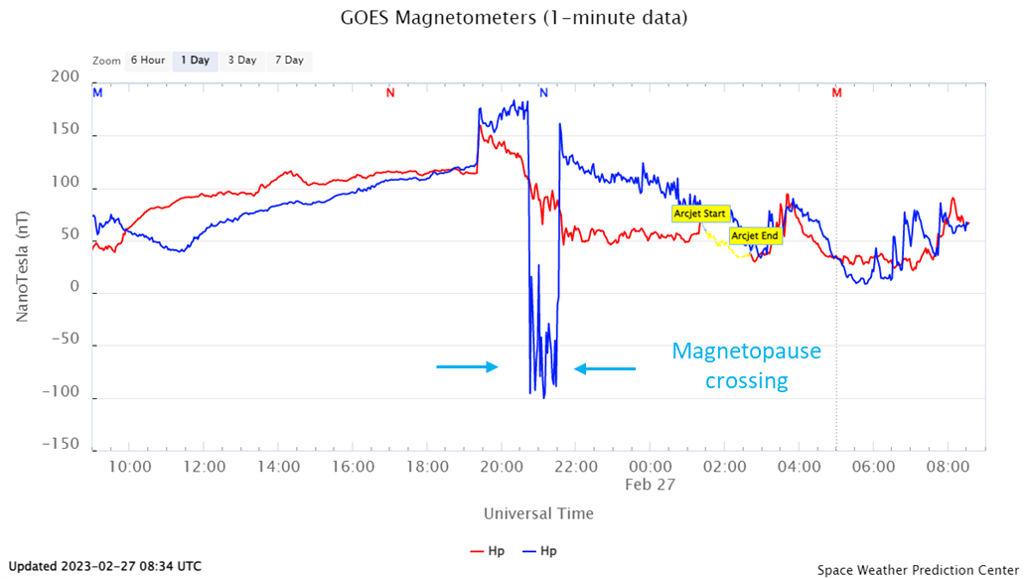
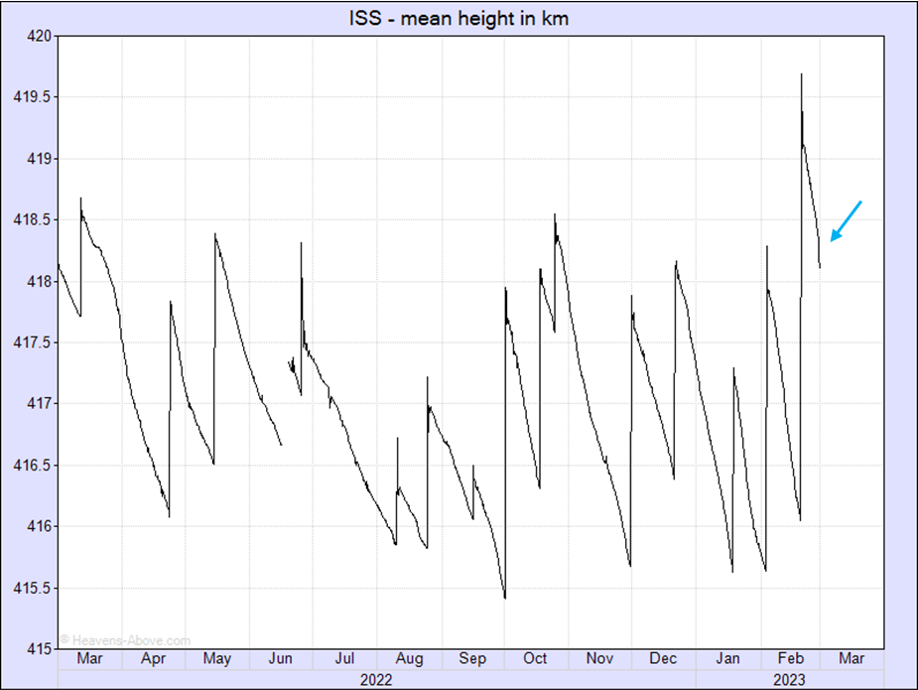
The GOES-18 satellite was briefly exposed to the solar wind during its dayside passage late on 26 February, as the strong first CME pushed the magnetopause, i.e. the border where the Earth's magnetic field strength equals that of the solar wind, just inside the geostationary orbit (graph). There also seems to have been a small drag effect on the orbit of the International Space Station, which apparently has lost about 200 meters in altitude on 27 February (graph ; courtesy Heavens Above). Note that in this case it concerned only a marginal effect, certainly when compared to e.g. the Bastille Day storm in July 2000 when the space station lost more than 10 km in a single day! More important was the ionosphere that got quite disturbed due to the geomagnetic storm. As a result, some GNSS-based applications for the civil aviation did not reach their typical availability, as can be gauged from the maps underneath for the USA/Canada (WAAS) and Europe (EGNOS), covering the period 24-28 February. Red/brown colours mean good availability, blue means significantly degraded availability. Clearly the systems were underperforming on 26 and especially 27 February. During the geomagnetically disturbed days, PECASUS issued advisories to the international civil aviation (ICAO) for degraded HF communications as well as for GNSS disturbances.
