NOAA 3376 was a decaying sunspot group when new magnetic flux started to emerge from 24 July onwards. This resulted in numerous M-class flares before it rounded the northwest solar limb on 27 July. Interestingly, it produced its most impressive eruption a day later while it was well behind the solar limb. The M4.1 flare peaked at 15:58 UTC (GOES). The wide-field SUVI 304 images (GOES) underneath show the eruption in all its -extreme ultraviolet- glory. The next clip combines the eruption in EUV with white light coronagraphic imagery from SOHO/LASCO C2 displaying the related coronal mass ejection (CME). The CACTus tool reported a plane-of-the-sky speed for this CME near 500 km/s.
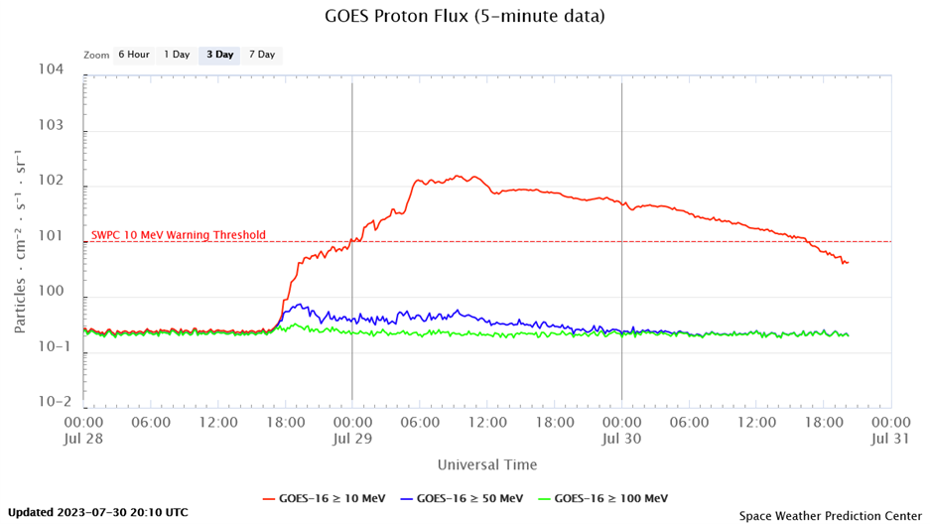
The eruption was also associated with a moderate solar radiation storm. The greater than 10 MeV proton flux reached a maximum of 154 pfu on 29 July at 09:20 UTC, as shown in the plot underneath (GOES). This is the second moderate radiation event of Solar Cycle 25, the first (and stronger) one being produced just 2 weeks ago (see this STCE newsitem). Some degradation of High Frequency (HF) communication over the polar caps might have occurred, and so an advisory was sent to civil aviation (PECASUS). As the fluxes of higher energetic protons remained very closely to background levels, no radiation advisory for civil aviation had to be issued.
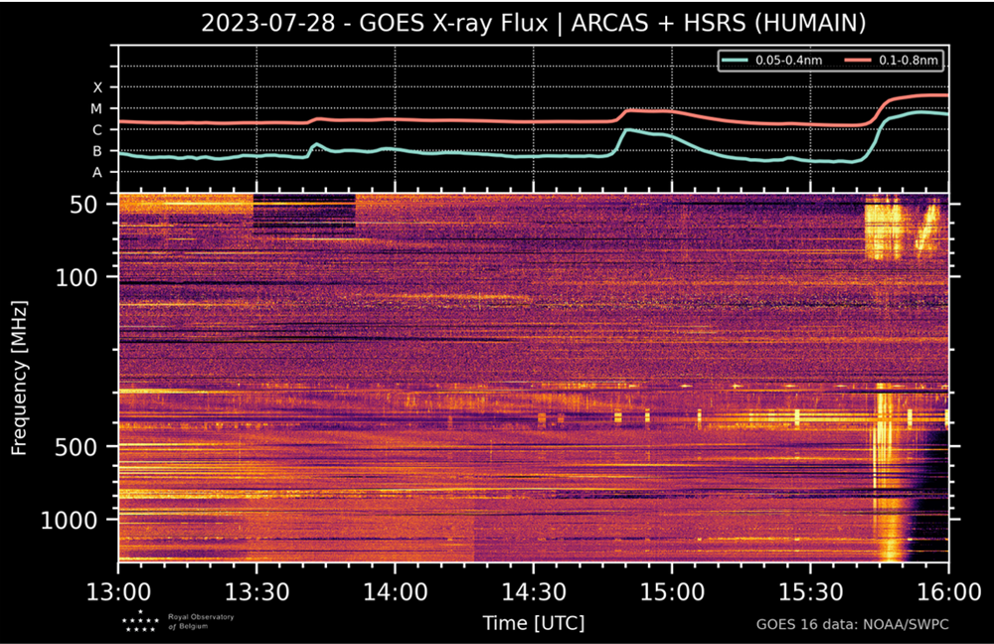
Associated with the eruption was Type V and Type II radio emission as reported by NOAA/SWPC. Type II radio emission is produced by electrons accelerated by CME-driven shocks in the corona. Type V radio emission is the longer–duration low–frequency component that looks to be "attached" to (and possibly emerging from) the decay phase of the Type III burst ahead of it, and thus seems to be related to electron beams propagating along open magnetic field lines. More information and examples are at the STCE SWx Classification page. The Humain Radioastronomy Station, which will have its Open Doors on 9-10 September, was able to record the radio bursts between 15:40 and 16:00 UTC as can be seen to the right in the spectrogram underneath. The horizontal axis represents time increasing from left to the right and the vertical axis represents frequency (in MHz) decreasing upward to represent the decreasing density with increasing altitude in the solar atmosphere. The evolution of the solar soft-x-ray flux is displayed on top of the spectrogram.
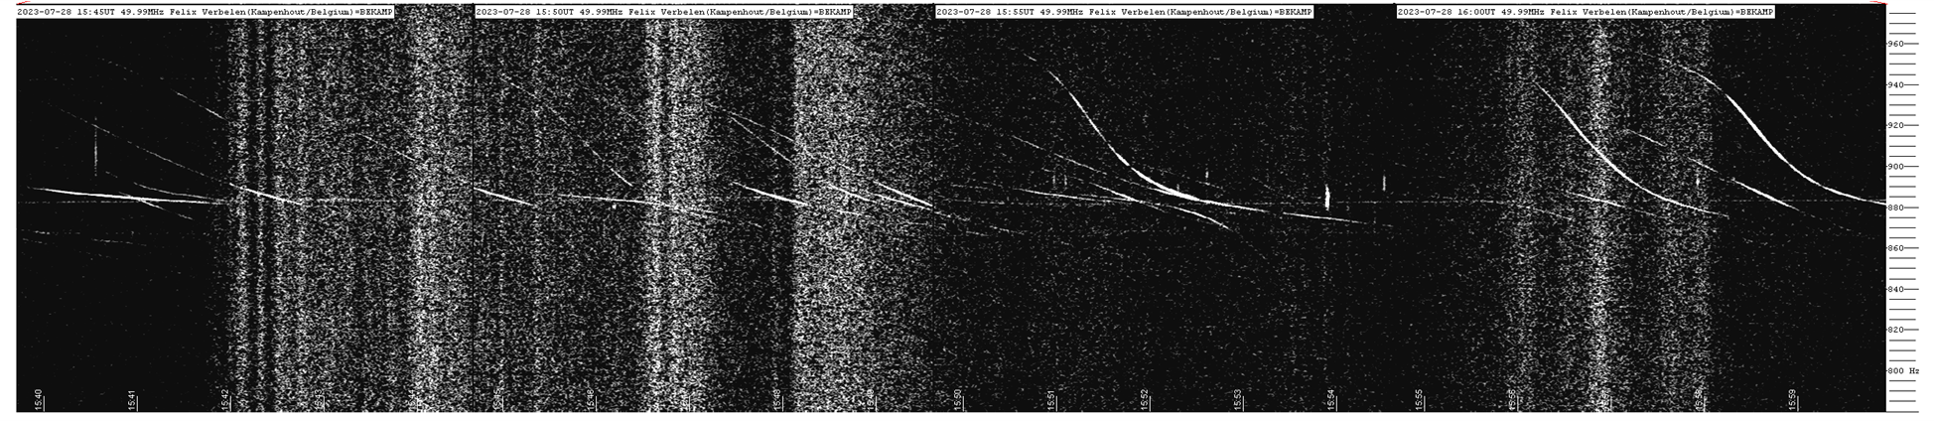
Radio meteor observers from the BRAMS network use the signal from a dedicated beacon that was installed in September 2010 at the Geophysical Center of Dourbes (South of Belgium), and which is emitting at a frequency near 50 MHz. The receiver, many kilometers away, scans a narrow frequency range of about 200 Hz centered around this beacon frequency. Meteors will (usually) show up as short, thin vertical lines in this radio spectrogram, the reversed-s shaped lines are from passing airplanes. More info and an example can be found in this STCE newsitem. The radio spectrogram underneath covers the timeframe from 15:40 to 16:00 UTC on 28 July and is courtesy Felix Verbelen from the radio astronomy group of the Belgian Astronomical Association. The noise that is evident in this spectrogram is -in this case- mostly due to the Type V and Type II radio bursts associated with the M4 flare and which can also be seen in the Humain radio spectrogram (upper right corner). Radio noise at this frequency is a nuisance to radio meteor observers, as it masks the faint signatures of the meteors.