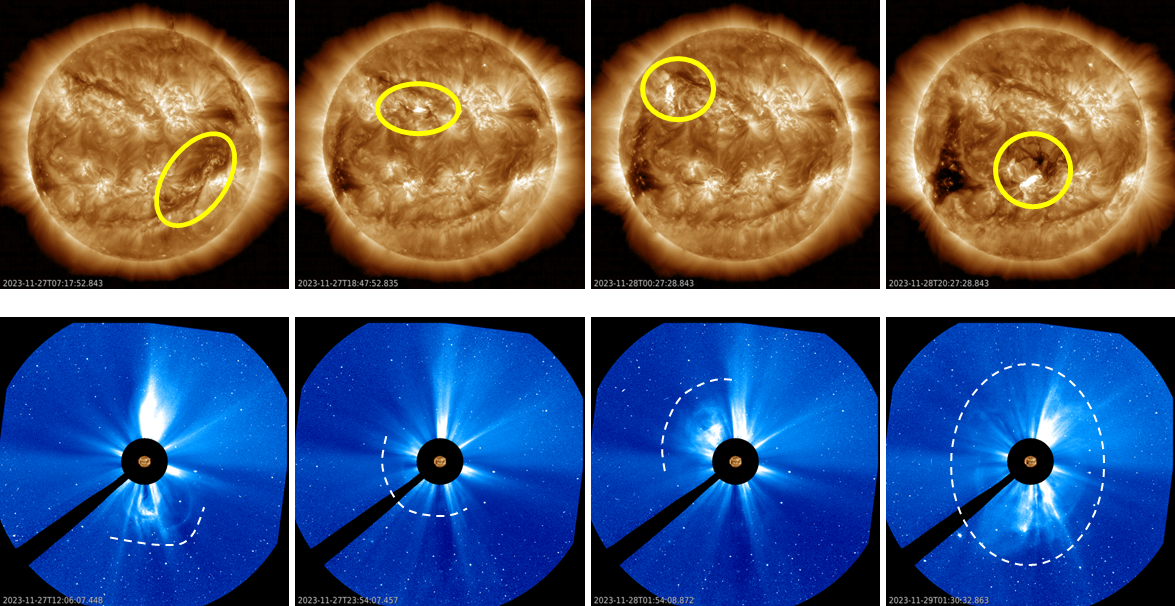
As the solar cycle is heading to its maximum, it's no surprize that the solar activity remains enhanced. Sunspot numbers exceeded 150 during several days late November. However, most of the eruptive activity was due to filament eruptions, such as for example on 27 and 28 November. Solar filaments are clouds of charged particles ("plasma") above the solar surface squeezed between magnetic regions of opposite polarity. Being cooler and denser than the plasma underneath and their surroundings, they appear as dark lines when seen on the solar disk. Special filters are required to observe these features, such as in the Hydrogen-alpha (H-alpha) line in the red part of the solar spectrum at a wavelength of 656.3 nm. The figure underneath shows extreme ultraviolet (EUV) images from SDO (AIA 193 - top row) with the eruption sources annotated and coronagraphic images from SOHO (LASCO C3 - bottom row) showing the associated coronal mass ejections (CMEs) outlined by dashed white lines. The eruptions took place around 05:30UTC, 18:30UTC, and 23:30UTC on 27 November, and around 20:00UTC on 28 November. The first 3 eruptions where associated with filament eruptions, the 4th eruption had NOAA 3500 as its source.


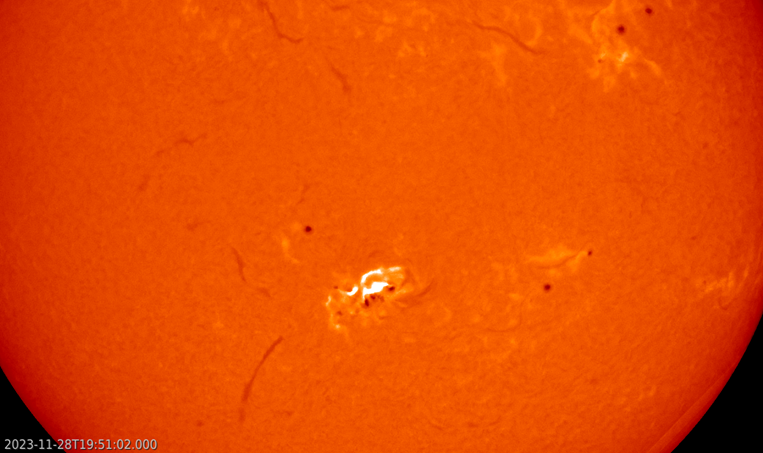
The 28 November eruption was also associated with the strongest solar flare of the period, an M9.8 flare peaking at 19:50UTC. This flare strongly affected the 10.7cm radio flux, increasing it to over 250 solar flux units (sfu), well above the background radio flux which was around 180 sfu at that time. The H-alpha imagery underneath is from the GONG network and shows a clear double (parallel) ribbon. The dark spots are the main sunspots, and the grayish lines are other filaments. The clip is a bit jittery as it combines observations from several stations of the network.
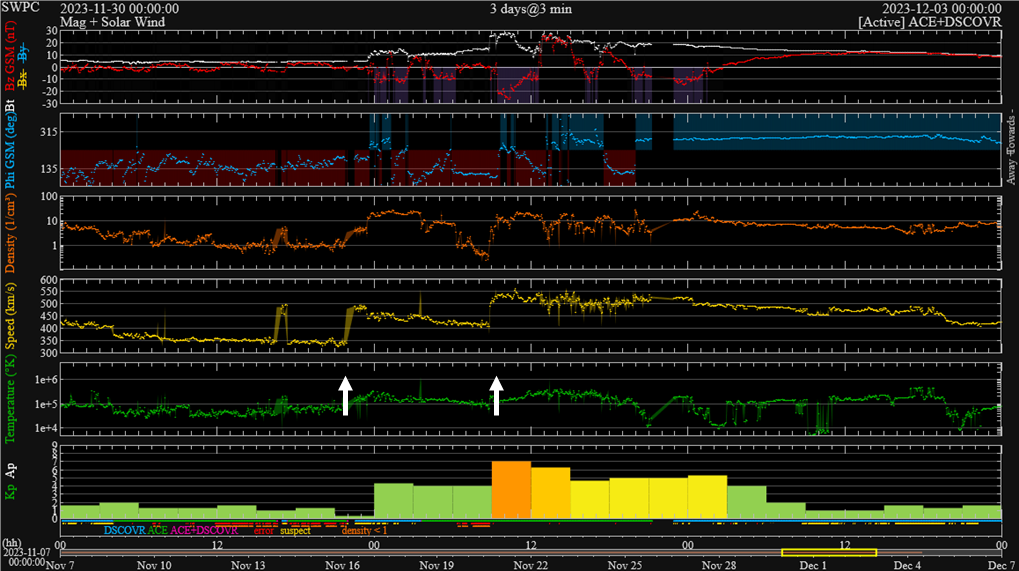
The associated CMEs had plane-of-the-sky speeds of resp. 400, 300, 700 and 450 km/s (CACTus). Correcting for the width and line-of-sight of each CME, and because of the quick succession of the eruptions, it was thought there was a good chance on a cannibal CME, meaning one CME catching up with the previous one thus creating enhanced magnetic fields that that might create extra disturbances in the geomagnetic field when it would pass the earth environment. The solar wind parameters (graph underneath - DSCOVR), indicate only 2 obvious increases in the CME speed (yellow curve; indicated by white arrows): one late on 30 November, when the wind speed increased from 350 km/s to 490 km/s, and a second abrupt increase on 1 December around 08:45UTC when the wind speed jumped from 410 to 530 km/s. The latter interplanetary CME was the strongest, with Bz - the north-south component of the interplanetary magnetic field - reaching -26 nT. This was likely the passage of the 28 November CME, with other solar wind parameters suggesting it had probably gobbled up one or 2 previous CMEs. Despite the very negative Bz, it did not last long, resulting in "only" a major geomagnetic storm (Kp = 7). Aurora were observed (photographed) as far south as California and Slovenia.