Last weekend's polar lights have been witnessed by millions around the world. While many drove to dark places to watch this celestial spectacle, others grabbed a lawn chair and watched the baffling show from their own backyard. Children were woken up by their parents to watch the colours in the sky. The 10-11 May aurora certainly captured the attention and awe of the public and the media. The evolution of this impressive geomagnetic storm can be found on the dedicated STCE webpage.
The timing of these aurora is no coincidence. Indeed, the maximum of the ongoing solar cycle 25 (SC25) is expected for the second half of this year and with smoothed monthly sunspot numbers near 140 (see the SILSO cycle forecasts webpage). The solar cycle is the waxing and waning of the solar activity over a period of about 11 years. This variation is best known from the rise and fall of the sunspot number. Sunspots are the dark "freckles" on the Sun, indicative of local magnetic disturbances at the solar surface. During the solar cycle maximum, there are more and more complex sunspot groups visible than during a solar cycle minimum. Such a large and complex group (NOAA 3664) developed just last week and was the source of several solar eruptions, sending magnetic clouds of charged particles to the Earth that eventually would lead to the extremely severe geomagnetic storm and aurora from 10-11 May. A description of this solar activity can be found on another dedicated STCE webpage.
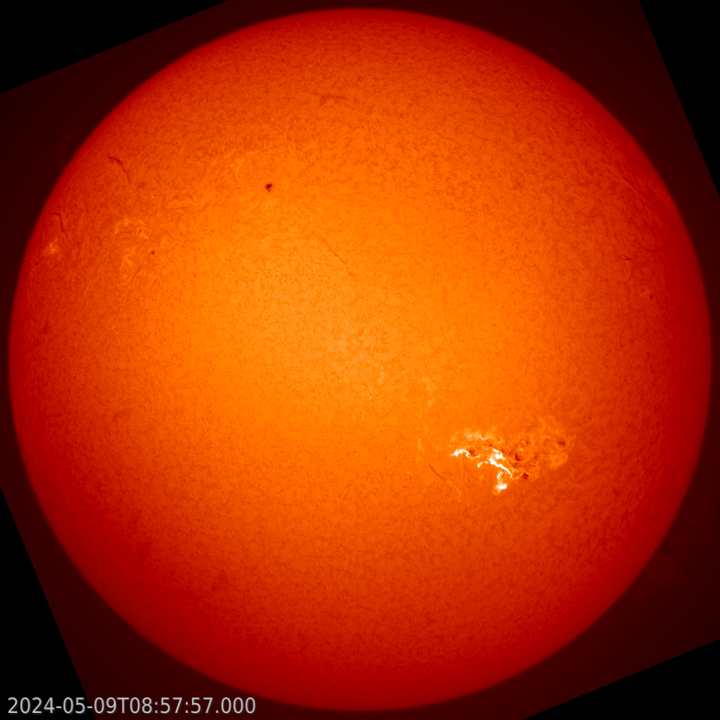
The picture above was taken by solar astronomers from SILSO on 9 May (USET). It shows a powerful eruption (X2.2) produced by NOAA 3664 as observed in the chromosphere, this is the inner atmosphere of the Sun. Some of the largest spots from NOAA 3664 can still be seen.
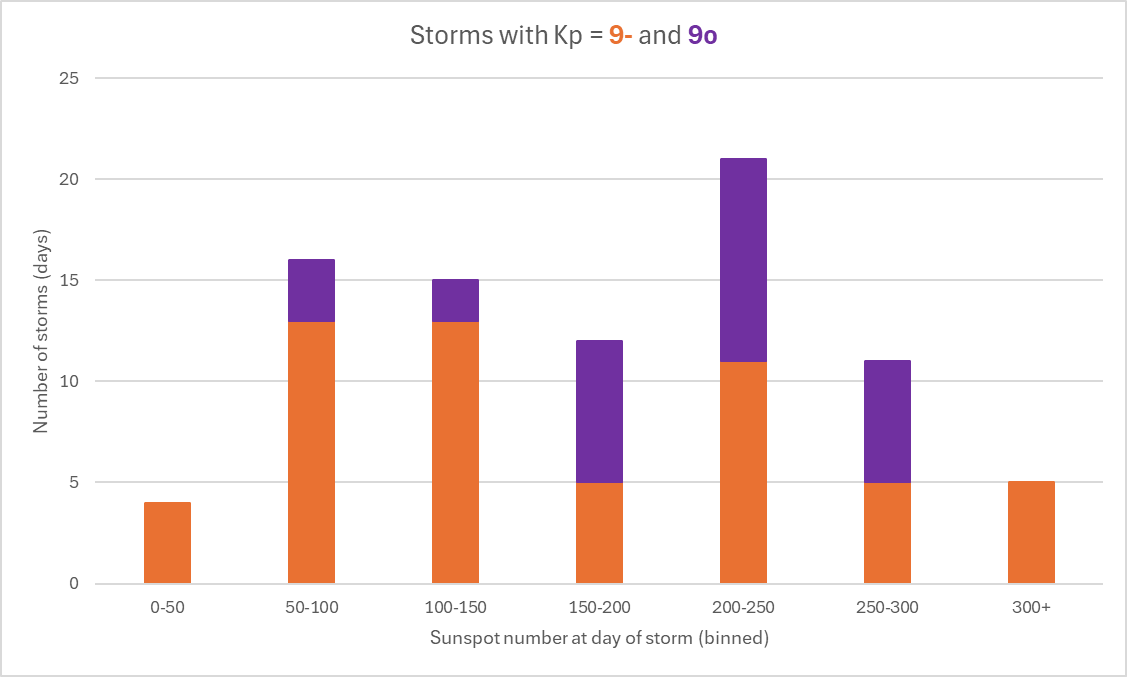
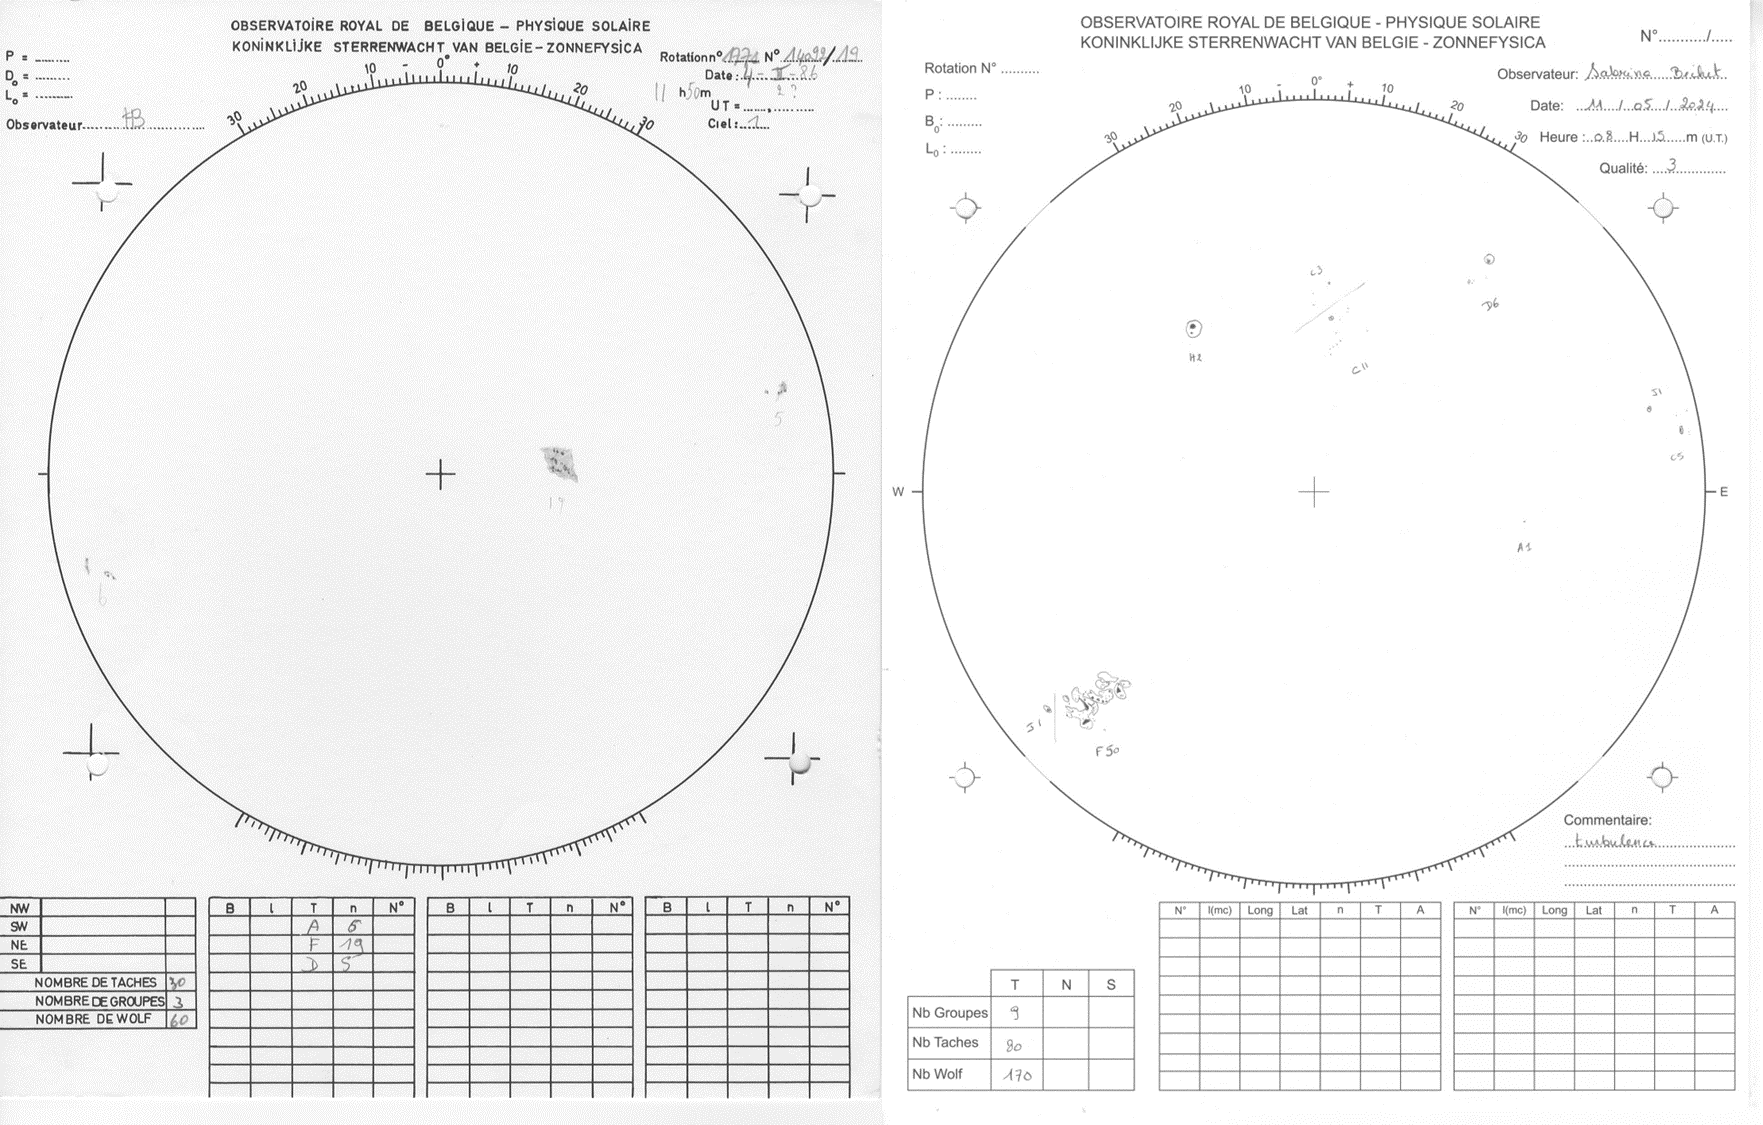
Contrary to popular belief, strong geomagnetic storms do not necessarily require high sunspot numbers. The bar diagram above shows, for the period from 1932 till present, the number of days with extreme or severe geomagnetic storming (technically, and in this article: "Kp = 9o or Kp = 9-") binned in daily sunspot numbers (per 50). As an example, there have been 21 extreme/severe storming days during which the daily sunspot number was between 200 and 250. It's clear there are also storming days when the sunspot number is much lower, e.g. 20 storms happened when the sunspot number was less than 100! An example is the 8 February 1986 extreme geomagnetic storm which happened during a solar cycle minimum with sunspot numbers only around 65! In the end, it is the presence of a well-positioned, complex, actively flaring sunspot group that determines if a geomagnetic storm will be the result. During a solar cycle maximum, such groups are of course more likely than during a solar cycle minimum, but it's not exclusive. The solar drawings underneath were made by solar observers from SILSO on 4 February 1986 (left) and 11 May 2024 (right), when the official daily sunspot numbers were resp. 66 and 162.