
One of the most puzzling observations during the previous solar cycle (SC24) was the lack of any coronal mass ejection (CME) associated with the 8 X-class flares (see the STCE SWx Classification page) produced by NOAA 12192 in October 2014. Several STCE newsitems have been dedicated to this sunspot region's activity and its lack of associated CMEs, e.g. this one.
One of the ways to divide solar flares is into two distinct classes: eruptive flares are associated with CMEs, and confined flares that lack CMEs. Because eruptive flares are the principal source of major space weather effects at Earth, relatively little attention was paid to confined flares until this big, flare-productive sunspot group NOAA 12192 transited the solar disk. Despite producing 4 dozen of M-class flares and 8 X-class flares (rescaled x-ray peaks; see this NCEI/NOAA document), all but four (M-class) flares were confined. For context, approximately half of all M-class flares and about 90% of the X-class flares have associated CMEs. The relative absence of CMEs in the large flares from NOAA 12192 has been attributed to magnetic suppression of eruptions by strong magnetic fields overlying the spot group (Chen et al. - 2015).
An example of an eruptive and a confined flare can be found underneath. On top is an M9.4 flare that was produced on 10 November 2024 by NOAA 13889. The left portion of the image is an extreme ultraviolet image (SDO/AIA 131) of the flare overlaid onto a white light image (SDO/HMI) of the sunspot group. On the right is a radio spectrogram obtained by the Radio-Astronomy Station in Humain, Belgium (HuRAS). The horizontal axis represents time, covering 30 minutes and starting just before the flare's peak in soft x-rays (12:06 UTC). The vertical axis displays frequency covering the range from 437 to 45 MHz. Note that the lowest frequencies are on top, such that structures leaving the Sun's atmosphere are moving upwards and to the right in this spectrogram. A clear disturbance, what is called a Type II radio burst, can be seen from 12:10 until 12:23 UTC. This type of radio burst is often associated with a CME shock (see the STCE SWx Classification page for more info), and a CME was later indeed observed in coronagraphic images.
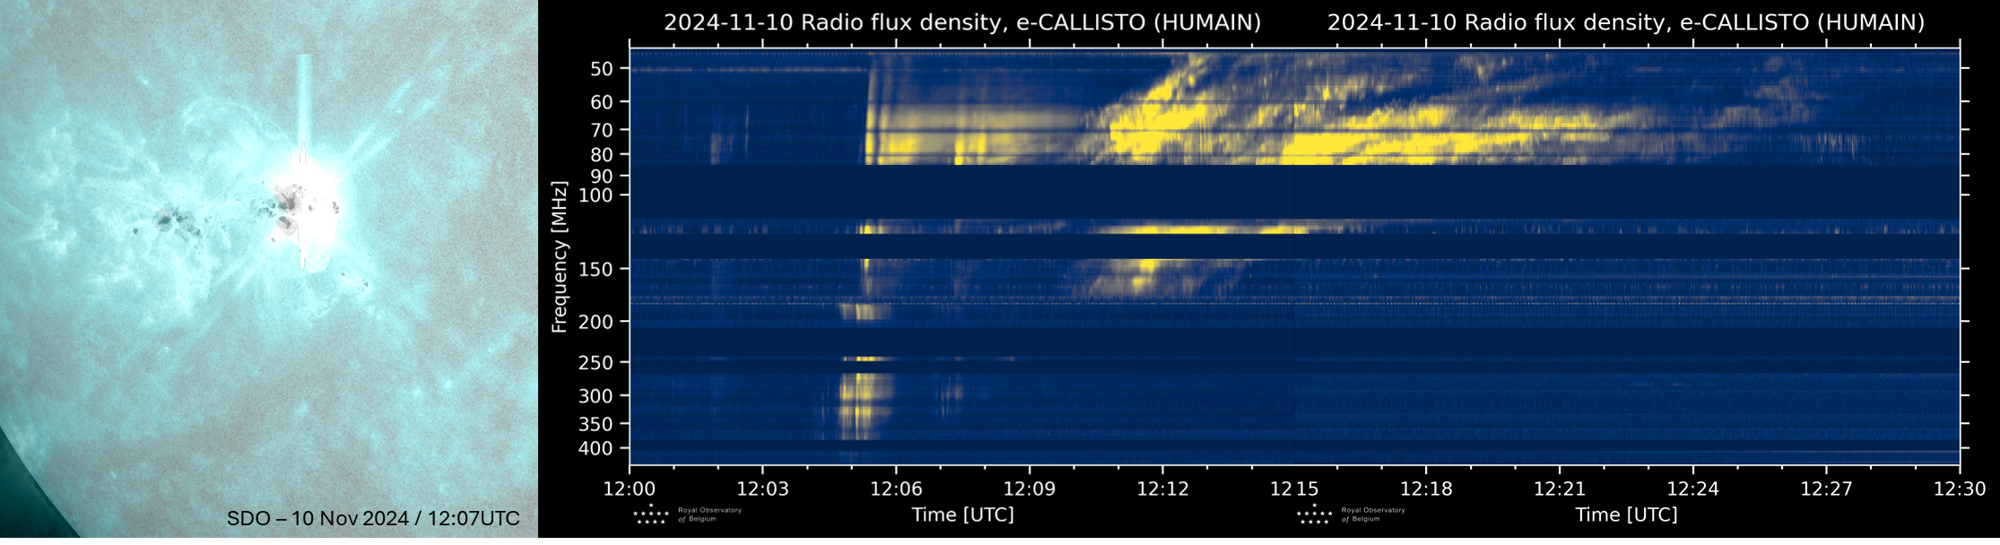

The lower portion of the image above is an example of a confined flare. It concerns an X2.9 flare that peaked on 27 October 2014 at 14:47 UTC and that was produced by NOAA 12192. The lay-out is identical to that of the M9 flare, with the SDO images about an hour after the flare's maximum intensity. In this case however, it's clear that there's no disturbance whatsoever in the observed radio frequency range, hinting at the absence of a CME shock. Indeed, no CME was seen in the subsequent coronagraphic imagery.
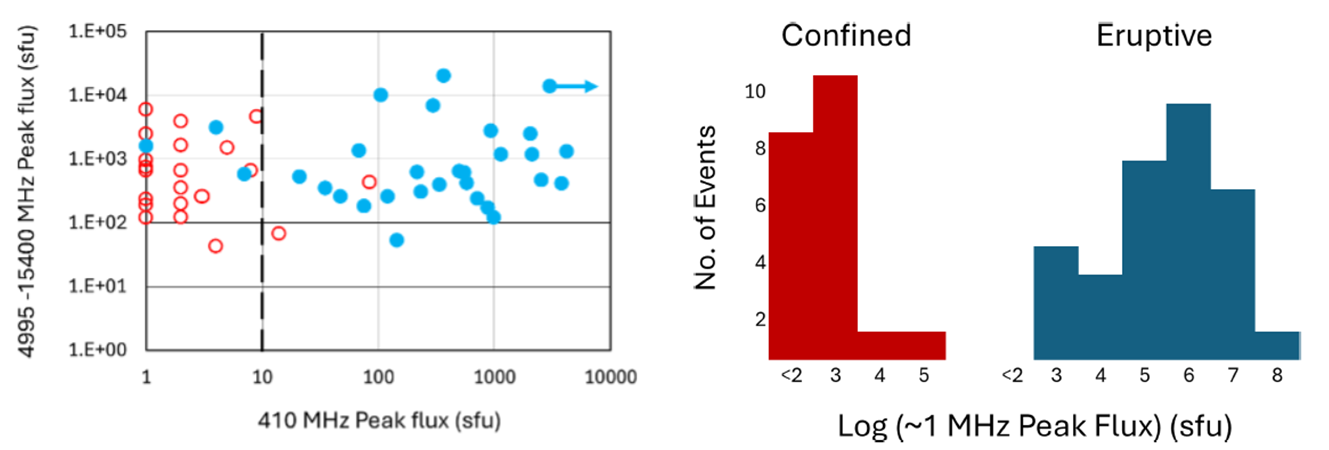
Recent research by Cliver et al. (2025) has further finetuned the way that radio waves may help in distinguishing confined from eruptive flares, with all flares in the study having a peak intensity of at least M5.0. They used observations from the US Air Force's Radio Solar Telescope Network (RSTN - data) -which monitors eight fixed frequencies (from 245 MHz to 15400 MHz) at four locations spanning the globe-, as well as Wind Waves observations at 1 MHz. They found that confined flares typically have a peak 410 MHz emission of less than 10 sfu (solar flux units) above background, whereas eruptive flares characteristically have a peak of 410 MHz emission above this level. This can be seen in the scatter plot underneath left, with the peak flux in the 4995-15400 MHz range on the vertical axis, and the peak 410 MHz flux on the horizontal axis. Confined and eruptive flares are shown in the graph by resp. red (21) and blue (30) data points. The dashed line indicates the threshold of 10 sfu (at 410 MHz) above which a solar flare is usually associated with a CME.
From the 1 MHz data, they concluded that to first order, confined flares lack emission above background at 1 MHz while eruptive flares have strong emission at this frequency. This can be seen in the bar diagram underneath right, with vertically the number of events and on the horizontal axis the intensity at 1 MHz (note the logarithmic scale!). According to the authors, because the plasma frequency at 1 MHz corresponds to a height of about 7 solar radii above the solar "surface", the absence of such emission in confined flares implies a lack of open magnetic field lines and escaping flare-accelerated electrons. Thus the underlying reconnection must be between closed magnetic loops, ruling out interchange reconnection between open and closed field lines for confined flares. The strong 1 MHz emission for the eruptive flares is then attributed to shock acceleration on open fields surrounding the expanding CME.
Though the study is based on a fairly limited number of data points, and the diagrams show a few exceptions, the found relationships may nonetheless provide additional support in an early distinction whether or not a CME is associated with a strong solar flare.
This newsitem was inspired on the research article by Cliver et al. (2025) as well as the condensed version of this article at CESRA / Solar Radio Science Highlights. The figure above was compiled from these two articles.
