
A compilation of the most memorable space weather moments of 2019 can be found underneath. Using the versatile (J)Helioviewer software, a ***MOVIE*** was created containing one or more clips of each event. Usually, SDO-images were used, occasionally supplemented with imagery from PROBA2, SOHO, and STEREO.
As this chronological list concerns mostly punctual events on the Sun, it does not contain clips from other noteworthy events in 2019, such as e.g. the transit of Mercury (11 November) , the space junk crisis (27 March), or the predictions for the upcoming Solar Cycle 25 (SC 25).
Happy viewing!
Event 1: 26 and 30 January - Two C5 flares produced by NOAA 2733
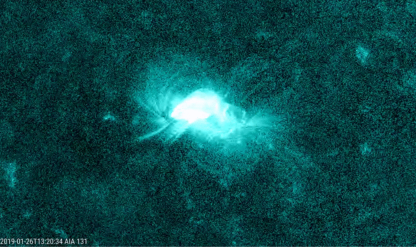
Active region NOAA 2733 started its development late on 21 January, remaining all-in-all a relatively small sunspot group. The trailing portion showed some magnetic mixing, with (small) sunspots of opposite magnetic polarity close to each other. This was the source location of the first C5 flare on 26 January (C5.0 peaking at 13:22UT). The active region then simplified, getting a more open structure and becoming less active. However while approaching the Sun's west limb, some new opposite polarity flux appeared south of the main leading spot, which had continued to grow over these few days. The new flux rejuvenated the flaring activity in NOAA 2733, which produced several C-class flares on 29 and 30 January. The strongest of the series was a C5.2 flare peaking on 30 January at 06:11UT. These were the strongest flares since the C8.1 flare produced by NOAA 2699 on 7 February 2018. None of the flares were associated with coronal mass ejections (CMEs).
Ref: STCE news item of 30 January 2019
Event 2: 8-20 April - NOAA 2738: largest sunspot of 2019
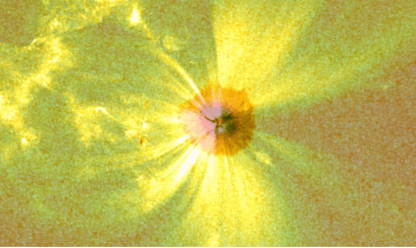
Active region NOAA 2738 rotated over the Sun's east limb as a single big sunspot on 7 April. It was probably the return of NOAA 2736 which had rounded the west limb just 2 weeks earlier as a rather complex and flaring active region. Using eclipse glasses, several solar observers reported NOAA 2738 as a naked eye sunspot from 10 till 17 April. NOAA 2738 was not very flare active, restricting itself to B-class flares. In white light imagery, fine, slowly moving bright structures that are overlaying the umbra (dark core of the sunspot) could be seen. These "light bridges" usually herald the decaying phase of the spot, however in this case, the sunspot did not fragment or become much smaller. A combination of white light and extreme ultraviolet (EUV) imagery shows the shape and the dynamics of the magnetic fields above and around the main sunspot. Indeed, as the magnetic field lines guide the motion of the heated plasma (charged particles) that are present, the otherwise invisible magnetic loops and towers of material in the corona glow brightly in EUV images. Some minor flaring can be observed too.
Ref: STCE news item of 17 April 2019
Event 3: 6 May - NOAA 2740 produces the strongest flare of 2019
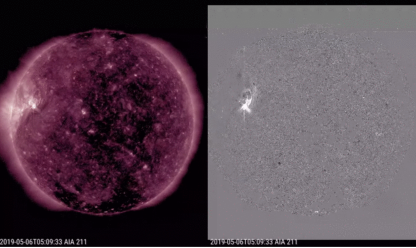
Active region NOAA 2740 became visible on 3 May, being most likely the return of NOAA 2738 which had completed its transit of the solar disk just 2 weeks earlier. Though still mostly a single sunspot, it had some small satellite spots to the north and northwest, which had an opposite magnetic polarity. This resulted in active flaring, with no less than 12 C-class flares. This was as many as NOAA 2736, but NOAA 2738 produced the strongest flare, a C9.9 on 6 May. So, this flare made it almost into the M-class group ("medium"). Quite a few of the flaring events seemed to be associated with a coronal wave (or EIT wave) to the north and northwest, as can be seen in the difference images (one picture subtracted from the foregoing picture) based on SDO's AIA/211 imagery (temperatures near 2 million degrees). Coronagraphic imagerey (CACTus) showed indeed CMEs, some of which had an earth-directed component.
Ref: STCE news item of 7 May 2019
Event 4: 14 May - Strongest geomagnetic storm of the year
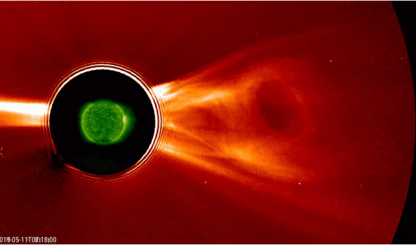
A moderate to strong geomagnetic storm took place on 14 May, with the estimated Kp reaching 7 and the (Quicklook) Dst index reaching -65 nT (WDC Kyoto). This was the strongest geomagnetic storm of 2019 and it was the result from eruptive activity near the Sun's central meridian on 10 and 11 May. The associated CMEs reached the earth environment on 14 May, with solar wind speeds up to around 570 km/s and Bz as negative as -15 nT. Further eruptive activity with coronal dimmings south of NOAA 2741 took place on 12-13 May, but the associated CMEs were mostly directed south of the ecliptic. The series of CMEs during the first half of May resulted in a 2-3% decrease of cosmic rays during 8-22 May compared to the rest of the year (Oulu neutron monitor). Due to the ongoing solar cycle minimum, cosmic rays were at very high levels and only slightly lower than during the previous solar cycle minimum transit in 2008-2010. Cosmic rays are known to pose a radiation hazard to passengers and crew on polar flights, and to astronauts. Increased cosmic ray levels affect the composition of the Earth's upper atmosphere, and it is also believed they may help trigger lightning and lightning-associated effects such as sprites.
Ref: STCE news items of 15 May 2019, 27 August 2019, and 16 December 2019, and the STCE Newsletters of 17 May 2019 and 24 May 2019
Event 5: 4 September - Very high levels of energetic electrons
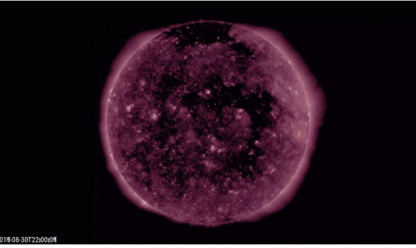
Early July, a small coronal hole (CH) started to develop in the northern hemisphere, possibly from an extension of the northern polar coronal hole (positive magnetic polarity). One solar rotation later, this CH had substantially grown in size, and during its transit late August it had evolved into a distinct shape resembling the number "7". After its October passage, the CH started to dissolve, but continued to mark its presence in the solar wind until December. Solar wind speeds reached maximum values of 600 or more km/s during each of its transits, with highest values near 800 km/s late August. During that transit, it created also one of the strongest geomagnetic disturbances of the year (31 August-1 September; Kp=6 , Dst=-52nT). Fast solar wind streams from coronal holes are known to drive highly energetic (energies of more than 2 MeV) electrons, which can lead to electrostatic discharges (ESD) resulting in malfunctions of a satellite and occasionally even in the satellite failure. The fluxes early September were very high, attaining values close to 90.000 pfu (1 pfu = 1 electron / cm2 s sr) on 4 September, or 90 times above the alert level! These values belong to the highest > 2 MeV electron fluxes observed during this solar cycle.
Ref: STCE news item of 11 September 2019
Event 6: 5 November - B1 flare in a spotless SC25 sunspot group
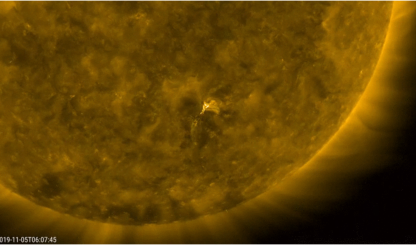
The last 2 months of 2019 saw a significant increase in the number of sunspot groups from the new solar cycle 25 (SC25). It concerned all small and short-lived regions. NOAA 2750 was visible early November. Its high southern latitude of -28 degrees and reversed magnetic polarity indicated this was a group of the new solar cycle. It was already spotless when it produced a compact B1 flare on 5 November. The flaring event was associated with post-flare coronal loops and some weak coronal dimming, but no obvious CME was observed in the available coronagraphic imagery. Of note is that only 32 C-class flares were produced in 2019, the last one taking place on 15 May. For the last M-class flare we have to go back all the way to 20 October 2017, and the last X-class flare took place on 10 September 2017!
Ref: STCE Newsletter of 14 November 2019
Event 7: 24-25 December - Two sunspot groups from the new SC25 visible at the same time
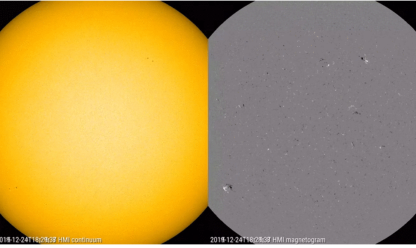
On 24 December, 2 sunspot regions of the new solar cycle (SC25) were visible on the solar disk at the same time. NOAA 2753, located in the southeast quadrant near latitude -30 degrees, developed late on 23 December. NOAA 2754 was located in the northwest quadrant near latitude +25 degrees, and developed during the morning hours of 24 December. The appearance of these groups halted a period of 40 spotless days that started on 14 November (preliminary SILSO data). It is the longest stretch of spotless days since 1996. It is also one of the longer stretches since the beginning of daily solar observations in 1849, making it all the way in the Top 10 of longest spotless periods. With 273 days, the year 2019 is also the most spotless year of the Space Age, ranking fourth in the list of most spotless years since 1849.
Ref: STCE news items of 16 December 2019 and of 25 December 2019
