
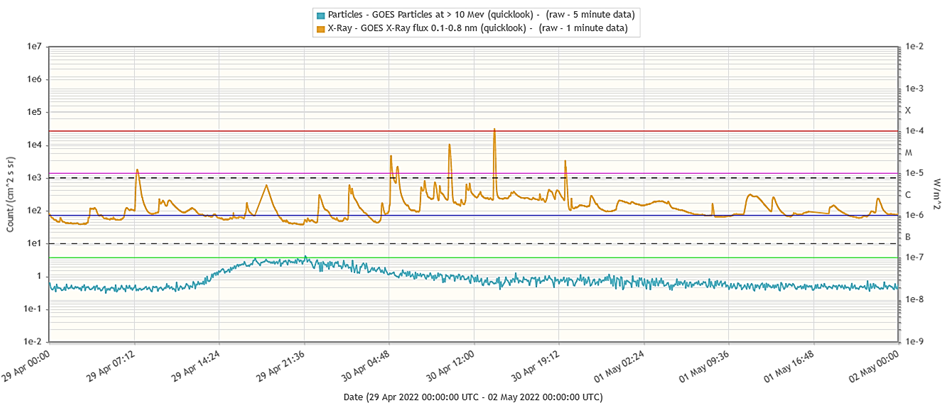
Solar flaring activity reached once again high levels last week following an X-class flare by active region NOAA 2994 on 30 April, as discussed in this STCE's newsitem. The graph underneath, created with the STAFF tool, shows the evolution of the x-ray flux and the greater than 10 MeV proton flux as observed by GOES . An enhancement of the proton flux can be observed but clearly starts prior to the X-class event and the series of M-class flares initiated by NOAA 2994. With only the M1.2 flare peaking at 07:30UT on 29 April, and no other important solar activity ongoing (including on the farside), it seems to be very likely that the proton flux enhancement was related to this M1.2 flare. Though the enhancement of the proton flux was fairly pronounced, its peak of 4.2 pfu remained well below the 10 pfu alert threshold.
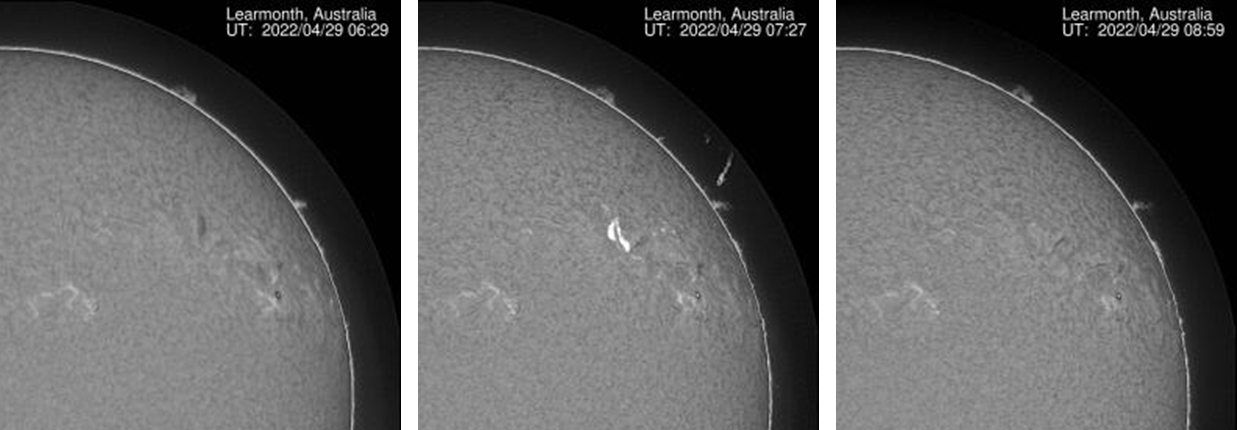
The source of the M1.2 event was the violent eruption of a small filament in the then spotless active region NOAA 2996. This can be seen in the H-alpha imagery underneath obtained by the Learmonth observatory as part of the GONG H-alpha network. Solar filaments are clouds of charged particles ("plasma") above the solar surface squeezed between magnetic regions of opposite polarity. Being cooler and denser than the plasma underneath and their surroundings, they appear as dark lines when seen on the solar disk. Special filters are required to observe these features, such as in the Hydrogen-alpha (H-alpha) line in the red part of the solar spectrum at a wavelength of 656.3 nm. The 3 H-alpha images show the outlook of the northwest solar quadrant before, during and after the eruption, when the filament has completely gone.
Extreme ultraviolet images such as from SDO/AIA showed quite some detail in the eruption. Images were taken around the time of the flare peak (difference imagery for AIA 171 and AIA 304). Aside the ejected material, the AIA 171 images (top - temperatures around 700.000 degrees) also show the post-flare coronal loops, whereas AIA 304 imagery (temperatures around 80.000 degrees) gives a better view on some of the material raining back to the Sun along the magnetic field lines.
The associated coronal mass ejection (CME) was quite fast with an estimated speed in excess of 1000 km/s. However, the CME did not seem to have an earth-directed component. The image underneath was taken around 09:00UT and combines a coronagraph image from SOHO/LASCO C3 with an EUV image of the Sun by SDO/AIA 171. The CME can be seen moving to the right and upper-right.
