
Last week's highlight certainly was the X1.5 flare on 10 May, peaking at 13:55UT. It was produced by active region NOAA 3006, which had also been the source of another X-class flare on 3 May. Both energetic events were previously discussed in these STCE newsitems (3 May and 10 May).
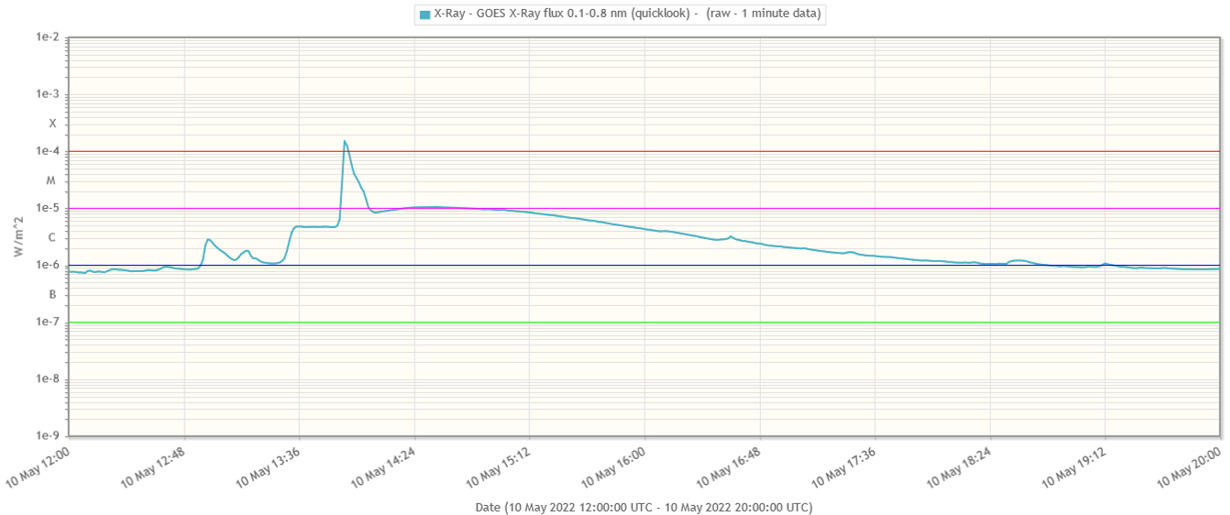
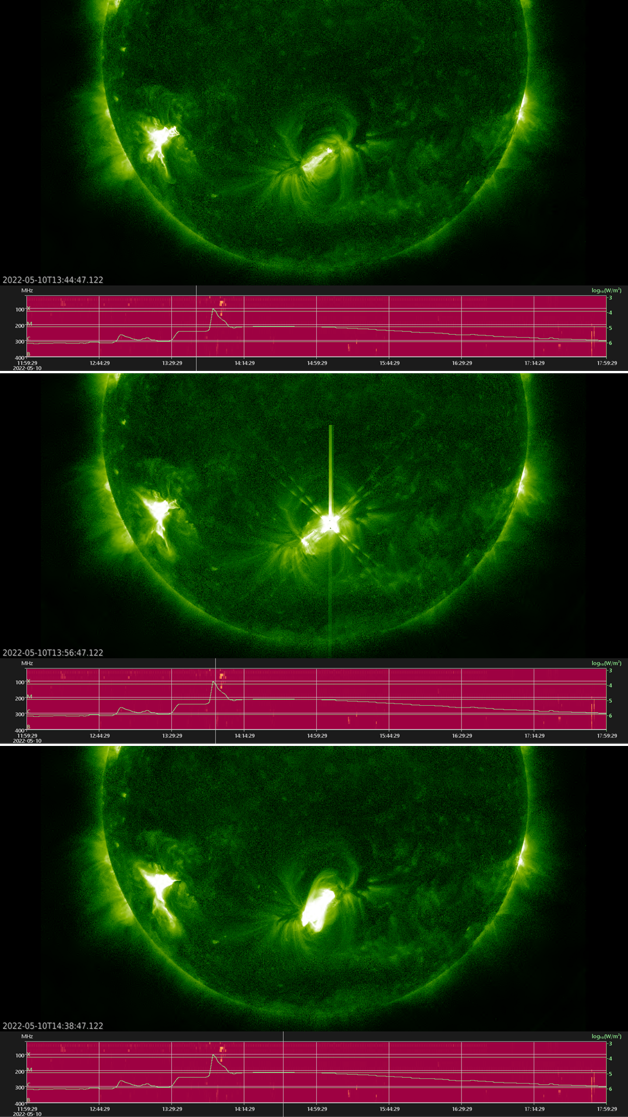
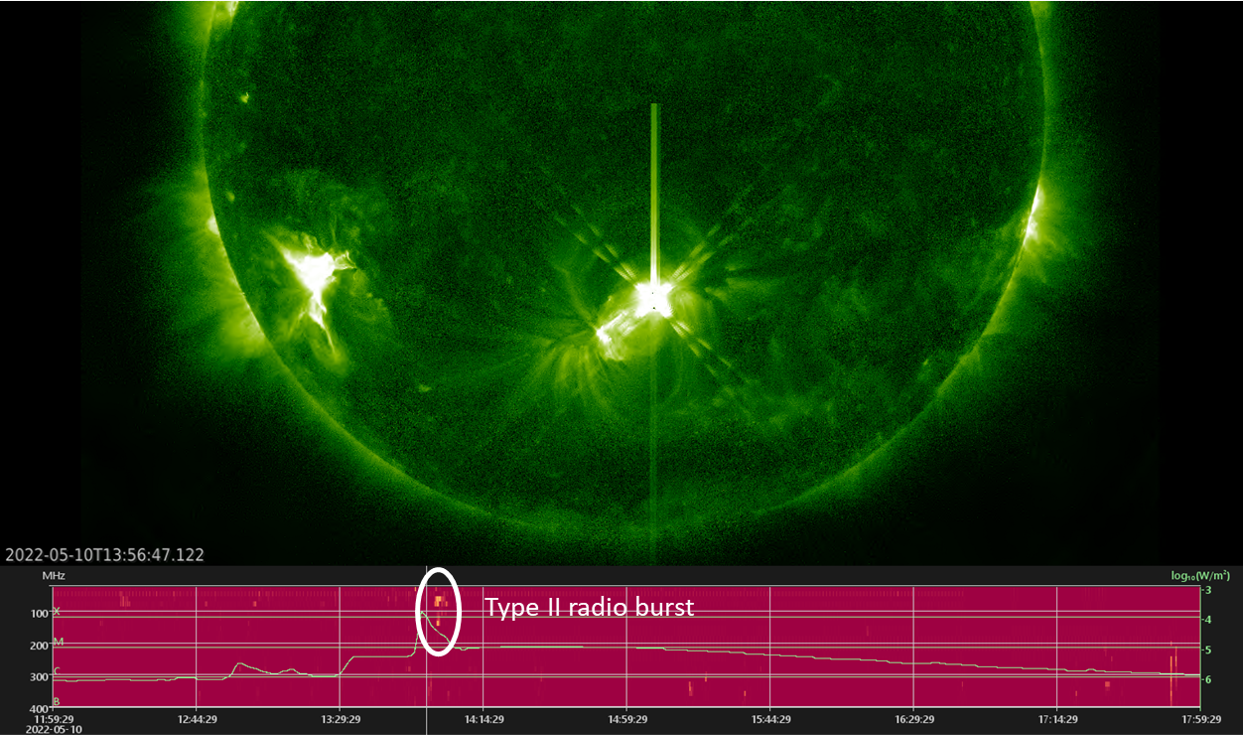
Upon closer examination, the soft x-ray (SXR) emission of the X1.5 event - as measured by the GOES-16 satellite showed a very atypical evolution. As is evident from the graph above (created with STAFF), there seemed to be a "step" in the increasing phase of the flare, which itself was an impulsive event lasting less than 10 minutes. Then came a shoulder-like structure with the X-ray flux hovering around the M1-level for nearly an hour, followed by a very slow decrease to pre-flare flux levels over the next 3-4 hours. The imagery underneath was created using the SWHV software. The greenish image taken by SDO/AIA 094 shows the Sun in EUV at multi-million degrees. The graphs under this image show the evolution of the soft x-rays (remember that the SXR flux data are from the entire Sun, not a single region), and a radio spectrogram (reddish background) from the Callisto radio network.
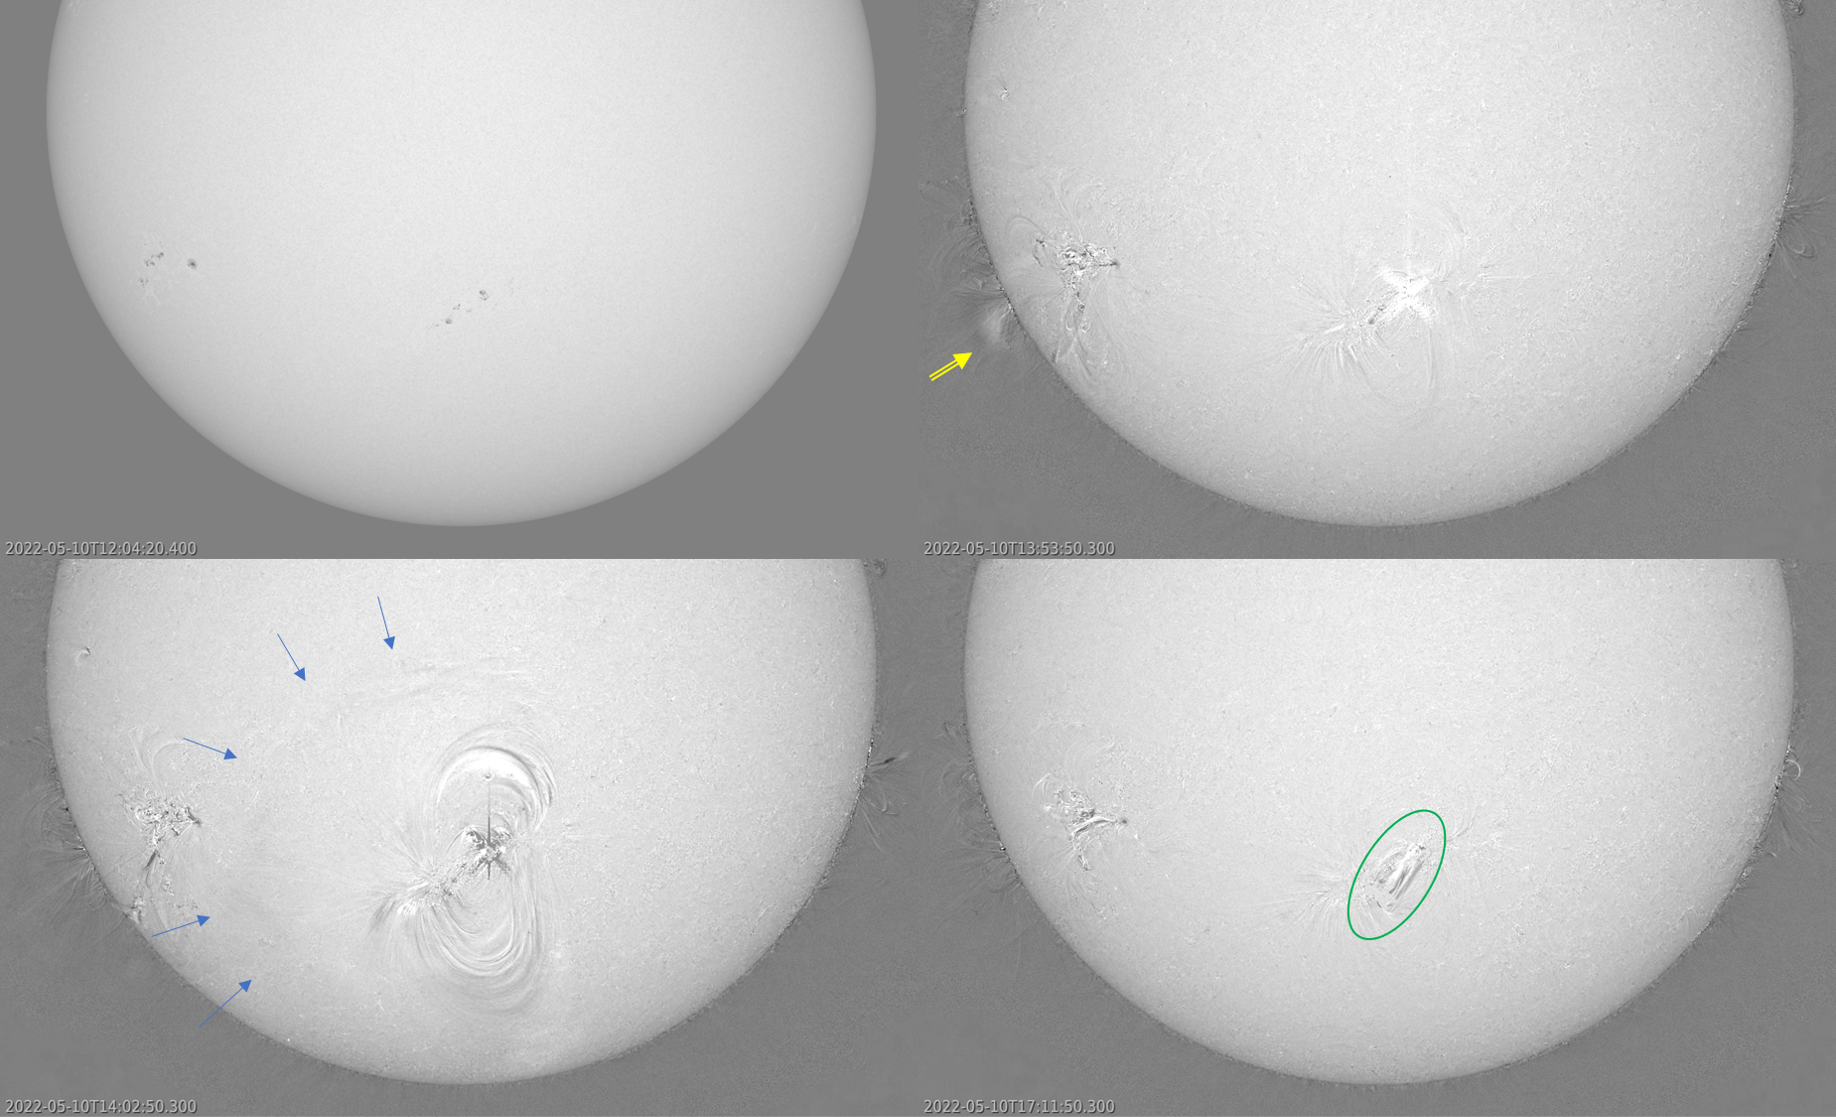
The step-like structure in the SXR curve was caused by an eruption in NOAA 3007 (top in the image above). It started around 13:28UT and reached a plateau near C4 about 6-7 minutes later and lasting for about a quarter of an hour, i.e. until the true start of the X-class flares in NOAA 3006 at 13:50UT. The SDO/AIA 094 images clearly show the enhanced emission in NOAA 3007 and nothing in NOAA 3006, thus "proving" that the step-like structure was not part of the X-class event (screen shot). The eruption in NOAA 3007 was quite complex and longlasting, with EUV imagery showing the ejection of a small, slowly moving, plasma cloud coinciding with the rise of the X-class flare. This can be seen in the imagery underneath where a difference SDO/AIA 171 image (one image subtracted from the next) is overlaid on a white light image (SDO/HMI). The faint ejected cloud can be seen over the southeast limb in the annotated upper right image attached.
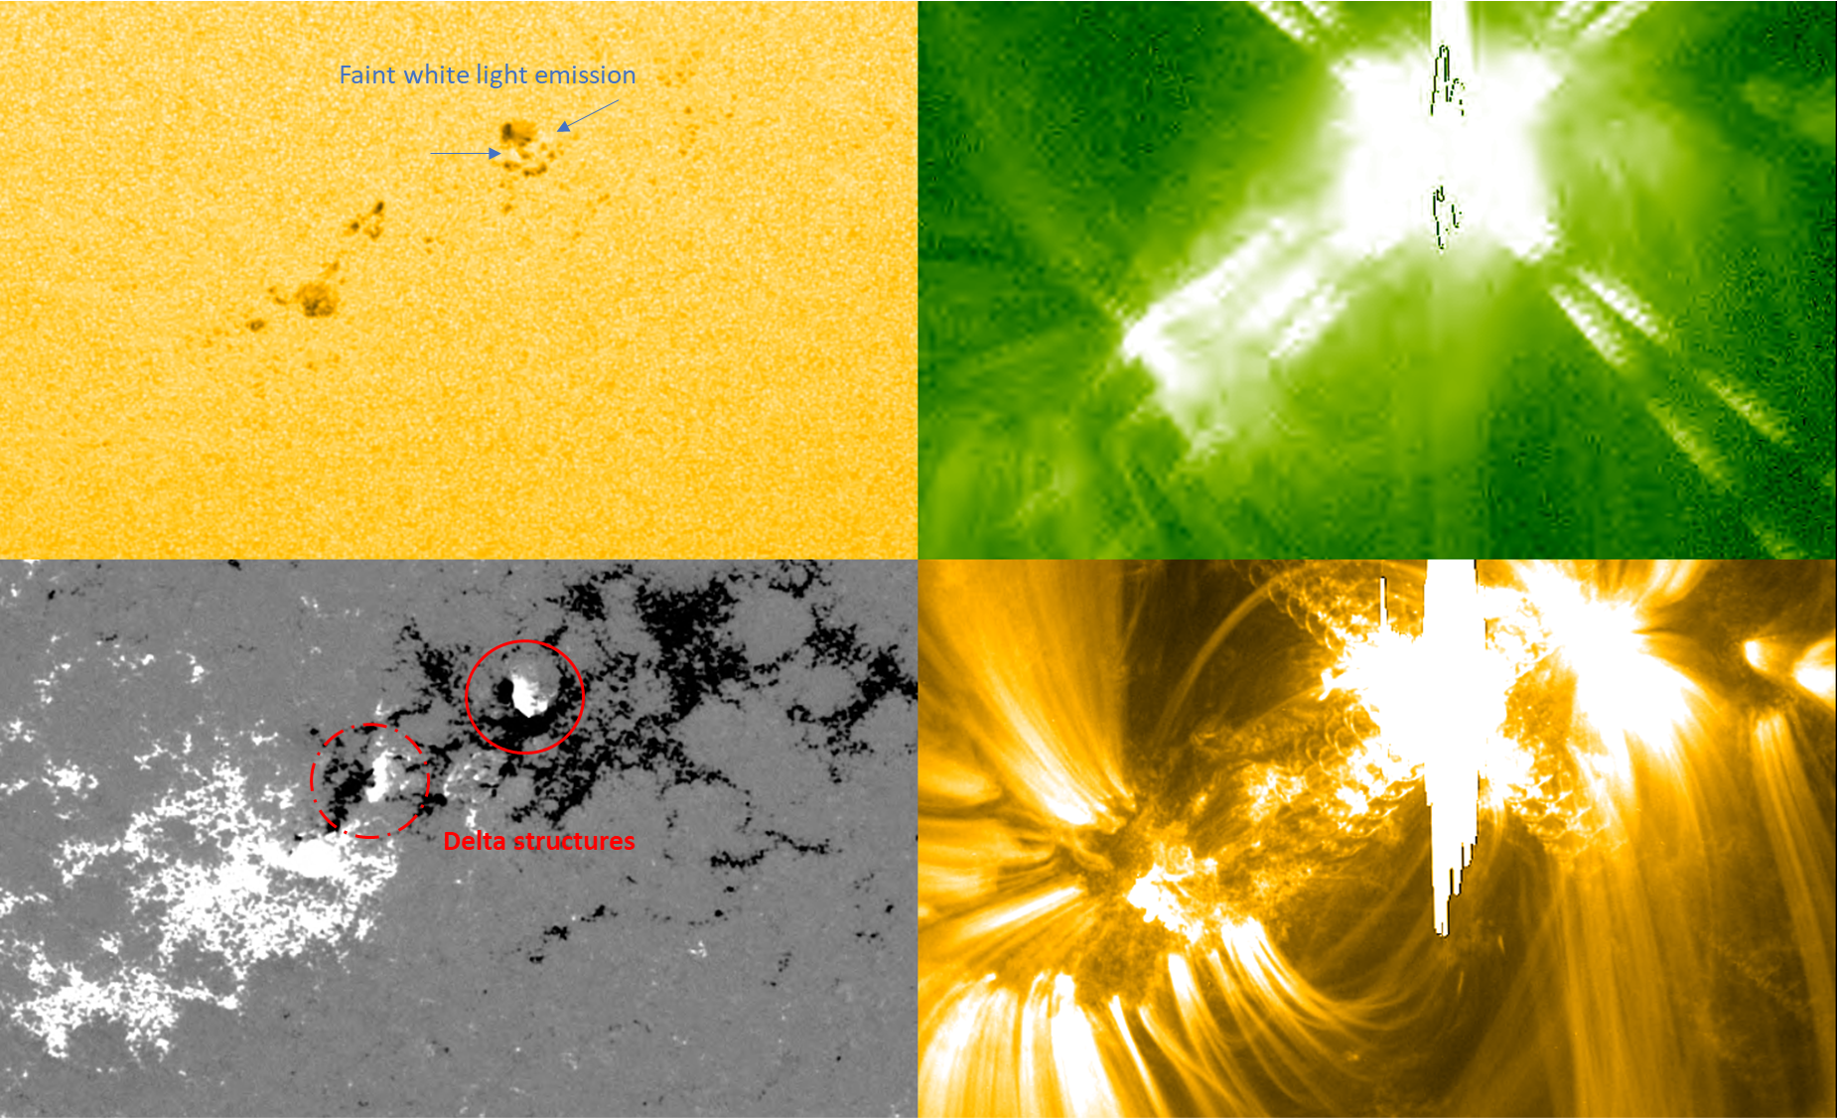
The X-class flare started at 13:50UT, reached its peak at 13:55UT, and ended at 13:59UT. It was located right over the leading delta spot, as indicated in the magnetogram underneath (lower left). Some white light emission can be seen in SDO/HMI (upper left) but in satellite imagery this is nothing extraordinary (annotated image). Of interest are some changes observed in the size and shape of the concerned sunspots (see the clip). The flare was clearly associated with a coronal wave, indicated in the SDO/AIA 171 difference imagery above (lower left image). It's curious to see this wave almost solely expanding in the north-east-south sector ("to the left"), and almost nothing to the west. There was no coronal hole in the neighborhood. The images show the blast area around the time of the maximum. The strong blooming and diffraction patterns that can be seen in the SDO AIA 094 and 171 images on the right are instrumental. For more on blooming and diffraction patterns, see Note 1 in this STCE newsitem.
The less than 10 minutes lasting X-class flare puts it in the family of "impulsive" flares, which are known usually not to be associated with coronal mass ejections (CMEs). However, the presence of a fast coronal wave and post-eruption coronal loops seem to contradict this. Also a Type II radio burst can be seen in the radio spectrogram and -based on its timing- does not seem to be associated with preceding eruption by NOAA 3007. The observed CME was mostly directed to the east and south of the Sun-Earth line.
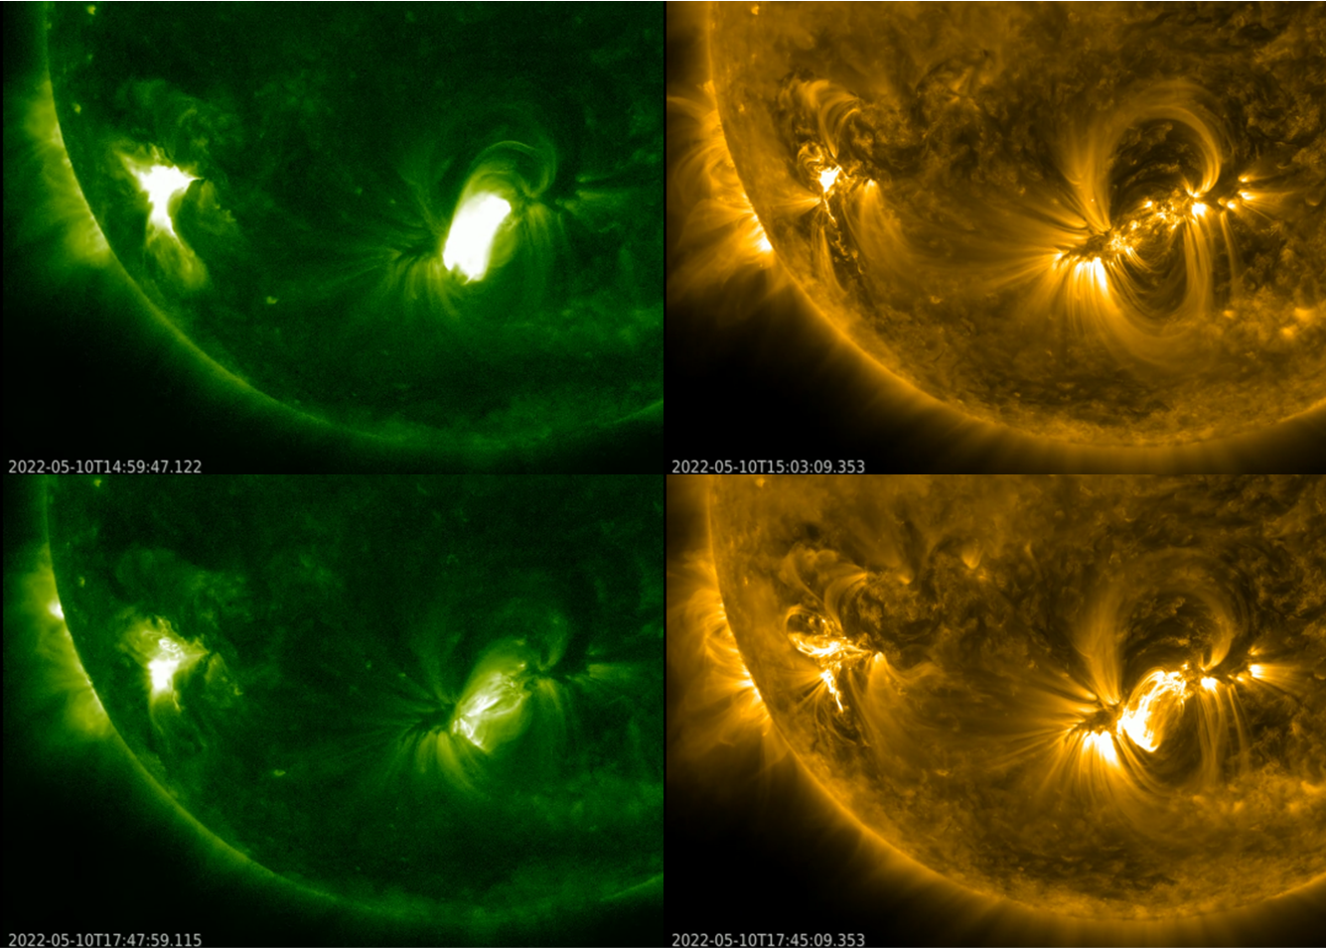
Another puzzling observation was the aftermath of the flare, with the SXR flux hovering around the M1 level for nearly an hour before gradually starting to decrease. This coincided with very bright patches (no fine structure) in AIA 094 over NOAA 3006. The interesting part here is that in AIA 171, which shows the solar atmosphere at temperatures around 700.000 degrees -so at a much lower temperature than in AIA 094-, nothing was seen. The first post-eruption coronal loops in AIA 171 only started becoming visible from around 15:45UT onwards (clip). Though there's usually a delay between the two, this time the delay of nearly 2 hours is unusual. The jury is still out on the precise cause of this difference. Maybe initially, the loops were too hot to be directly visible in AIA 171, and so we had to wait until they had cooled down sufficiently to become visible with the AIA 171 filter. It took until around 19:00UT before the SXR flux was back at pre-flare levels.
