
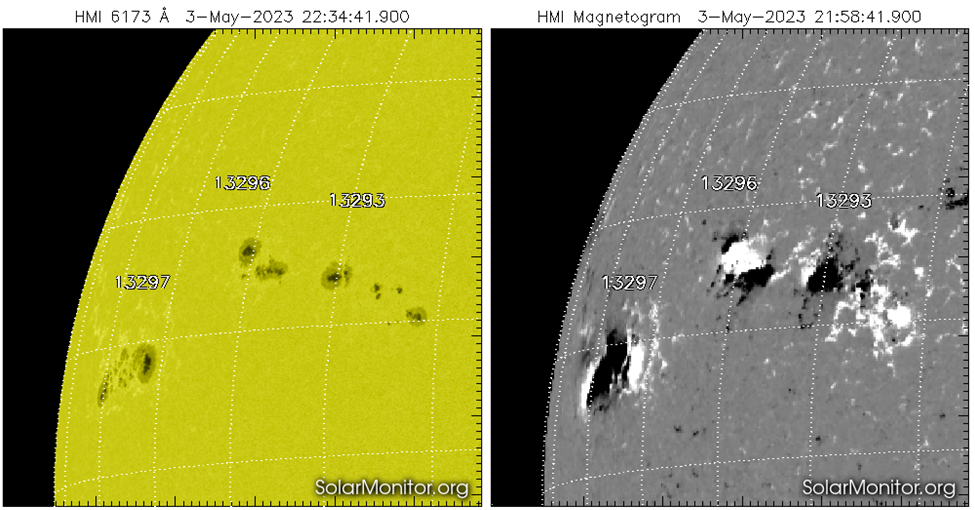
From 1 May onwards, a new grouping of active sunspot groups rotated over the northeast solar limb. The trio consisted of active regions NOAA 3293, 3296 and 3297. NOAA 3297 was the largest group, but had a relatively simple magnetic configuration and thus produced only some C-class flaring. NOAA 3293 contained initially a delta structure in its middle portion (see last week's newsitem), which resulted in 4 M-class flares on 3 May, including the strongest flare of that week (M7.2). The SDO/HMI images underneath show the sunspot groups in white light (left) and the corresponding magnetogram (right) late on 3 May, i.e. when the delta structure in NOAA 3293 was disentangling. In the magnetogram, the white colour denotes magnetic field lines coming out of the solar surface ("positive" polarity), the black colours mean magnetic field lines returning to the solar surface ("negative" polarity).
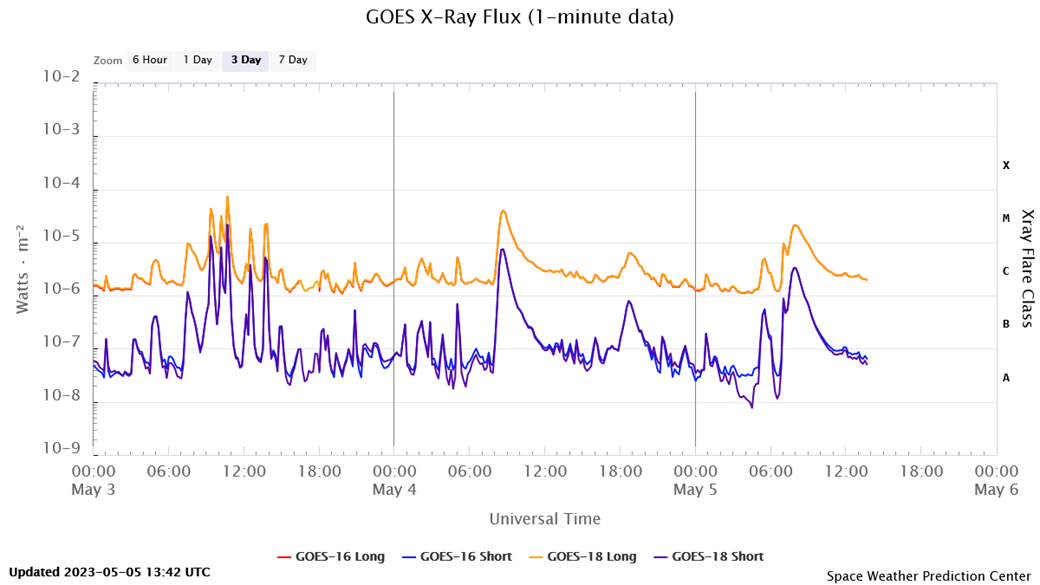
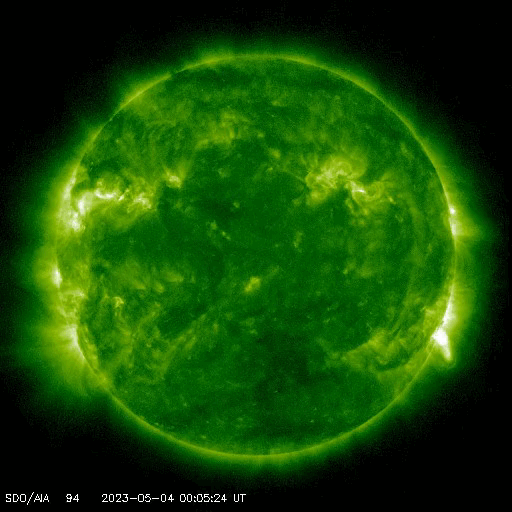
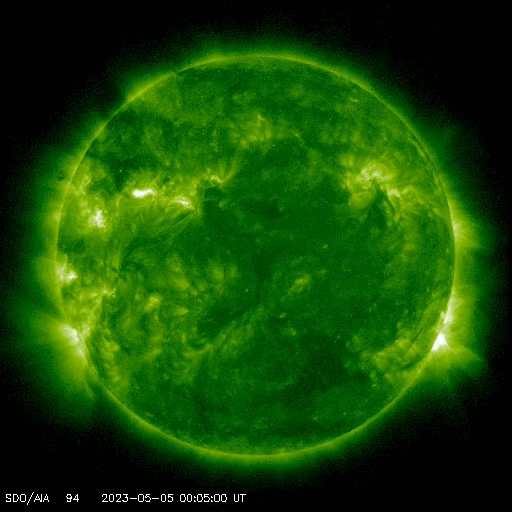
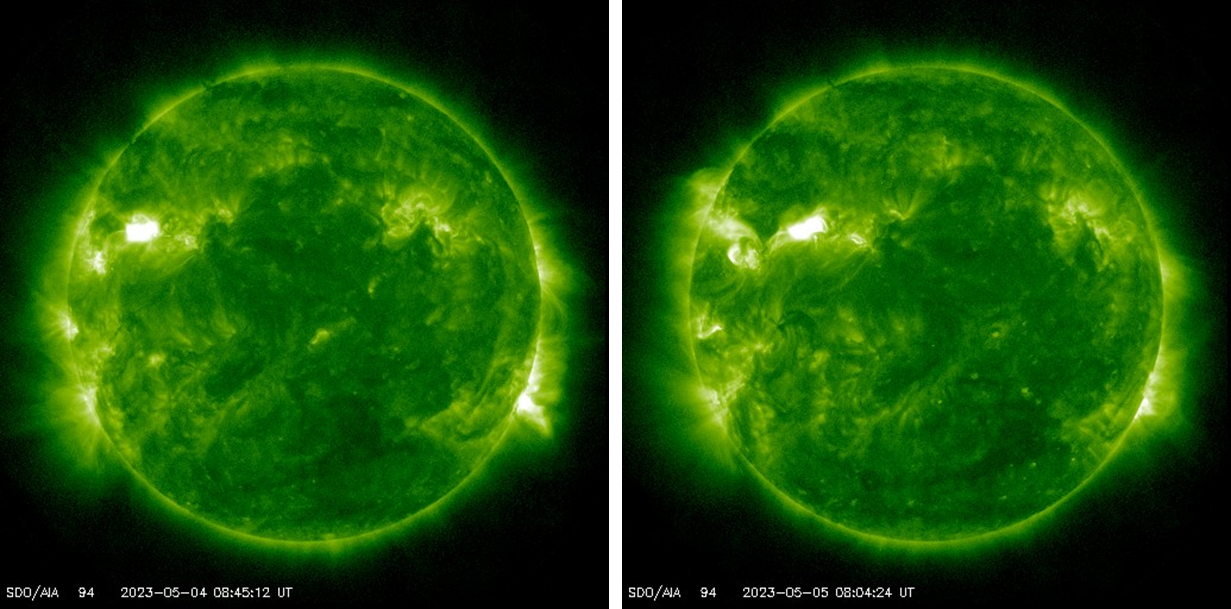
Sunspot group NOAA 3296 then took over from NOAA 3293 in terms of flare production. NOAA 3296 had actually a reversed magnetic polarity, meaning that it had a magnetic configuration opposite to what can be expected for bipolar sunspot regions in the northern solar hemisphere this solar cycle. This can also be seen in the magnetogram above, where the leading sunspot of NOAA 3296 has a negative polarity (black colour) and the main trailing spot a positive polarity (white colour), opposite to the configuration in sunspot regions NOAA 3293 and 3297. Sunspot groups with such an inverted (also known as "anti-Hale") configuration are not too numerous, with only between about 3 to 8% of all sunspot groups during a solar cycle (see e.g. McClintock et al. 2014). It has been shown statistically that these groups have a higher likelihood on producing solar flares (Toriumi et al. 2019), and NOAA 3296 supported this by producing 4 M-class flares over the next 4 days. The graph underneath (GOES) shows the first two (and strongest) flares from this region: an M3.9 flare on 4 May, and an M2.1 flare on 5 May. Both were long-duration events. The SDO/AIA 094 clips underneath show the two flares and other flaring activity in extreme ultraviolet on 4 and 5 May (still).
 |
 |
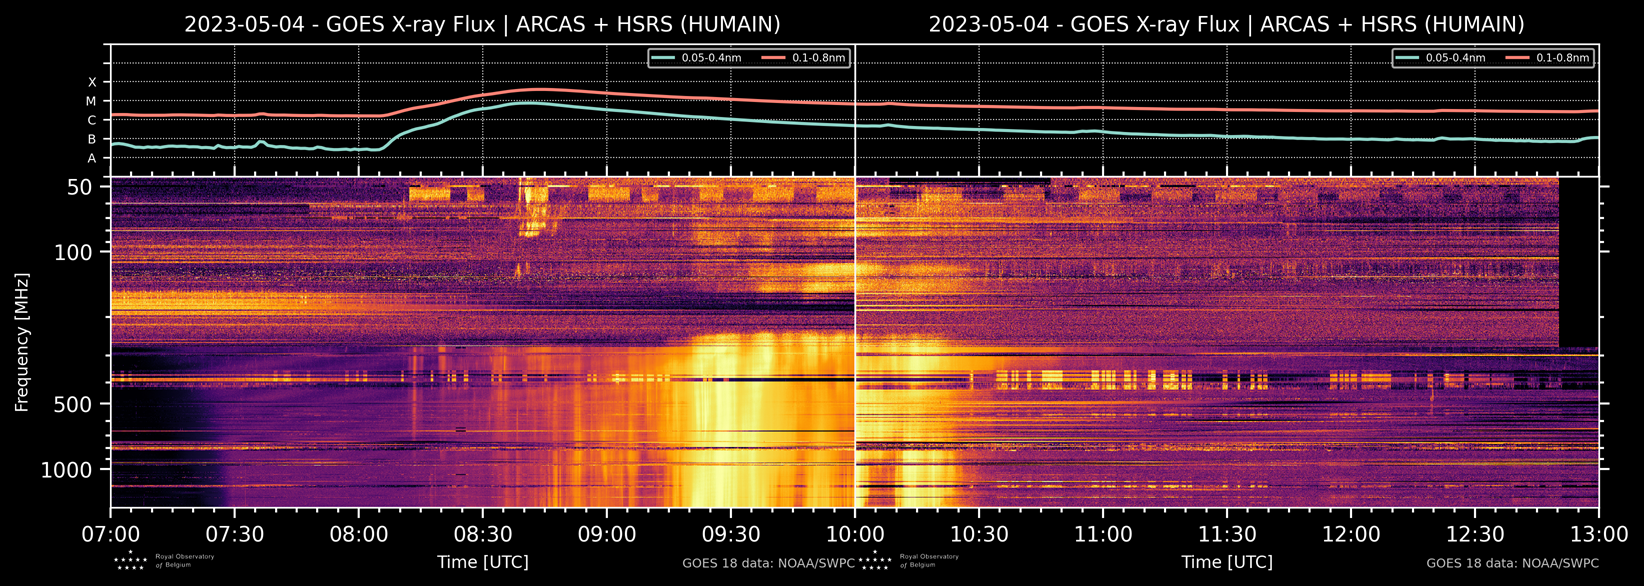
These two flares were accompanied by important emissions on radio frequencies. In particular the 4 May M-class flare produced one of the strongest radio bursts on GNSS frequencies (Global Navigation Satellite System, such as GPS and GALILEO) so far this solar cycle. The Radio Solar Telescope Network (RSTN ; NOAA/SWPC event reports) reported a peak value of 26.000 sfu (solar flux units) at 1415 MHz around 09:30 UTC. This is a relatively high value compared to the typical quiet Sun value during solar cycle maximum (around 100 sfu) and other radio bursts at these frequencies (usually a few 100 to a few 1000s sfu). The radio spectrogram underneath was recorded by the radio telescopes at Humain, Belgium (operated by the SIDC). It shows for the period from 07:00 till 13:00 UTC (horizontal axis) the intensity (coloured) over the frequency range from 45 to 1495 MHz (vertical axis). The top of the graph shows the evolution in soft x-rays as recorded by GOES.
From around 08:30 till 10:30 UTC, there's a clear enhancement of radio emission between 200 MHz and (beyond) 1495 MHz. This is called a Type IV radio burst, i.e. quasi–continuum features over a wide range of frequencies associated with the decay phase of solar flares. They are attributed to electrons trapped in closed field lines in the post–flare coronal loops produced by flares, implying an ongoing acceleration somewhere in these loops (White 2007). Type IV bursts have long been of interest in space weather studies because they are often associated with solar energetic particle events, which were however not observed during the 4 and 5 May M-class flares. More examples can be found at the STCE's SWx classification page.
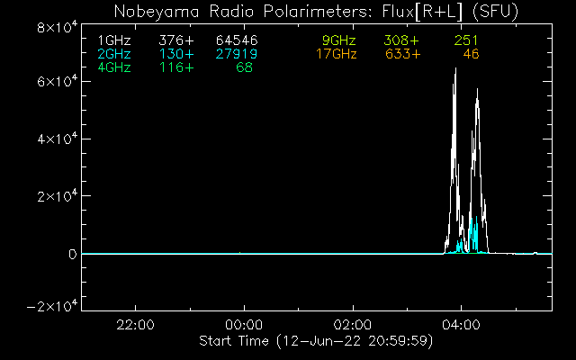
In the past, strong Type IV radio emissions ("radio noise") have been the source of severe GNSS outages. Notorious are the 6 December 2006 (Cerruti et al. 2008) and 24 September 2011 (Sreeja et al. 2013) events where maximum power of respectively 1.000.000 (1 million!) sfu and 110.000 sfu at GNSS frequencies were recorded. The map underneath was based on Figure 3 of the Sreeja et al. (2013) paper and shows the impact of the 24 September 2011 radio burst on the GNSS technologies at 13:04 UTC. The dots indicate the approximate location of the GNSS receivers analyzed in the Sreeja study. A blue coloured dot indicates that the normal number of satellites were being tracked (4 or more). Prior to the burst, all dots were blue. During the burst, which adds a lot of radio noise at the GNSS frequencies, several sunlit receivers were not able to track the four satellites required for a full positioning solution (marked in red). Similar effects were observed during the 6 December 2006 radio burst, but this time the affected area was much wider, with impacted receivers located over the United States, Latin-America, the middle and eastern portion of the Pacific, and even Antarctica (see Figure 6 of the Cerruti et al. (2008) paper). Any effects from the 4 May radio burst, as well as from the 2 strongest bursts so far this solar cycle on 28 August 2022 (saturation effects?) and on 13 June 2022 (98.000 sfu by San Vito (Italy) at 1415 MHz; 64.000 sfu by Nobeyama (Japan) at 1 GHz) are thought to be much smaller and of much shorter duration than the 2006 event, and are currently being scrutinized.
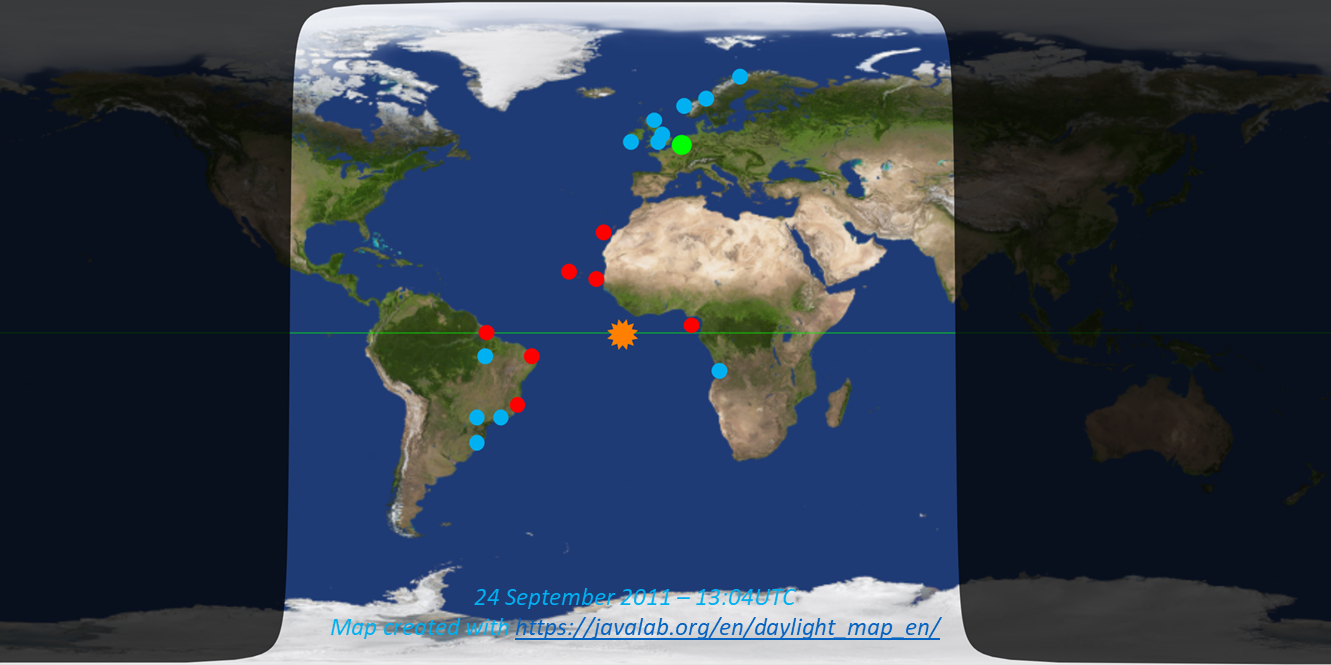
Background map created with Javalab.
