With several flare-active sunspot regions transiting the solar disk, solar activity has been high over the last few weeks. In particular NOAA 3296, as discussed in last week's newsitem, produced numerous moderately strong flares (M-class flares). Many of these flares were associated with a coronal mass ejection (CME), a few of which even had an earth-directed component. In the coronagraphic images underneath (SOHO/LASCO C3), a clip covering the period from 8 till 12 May shows the CME-activity during this period.

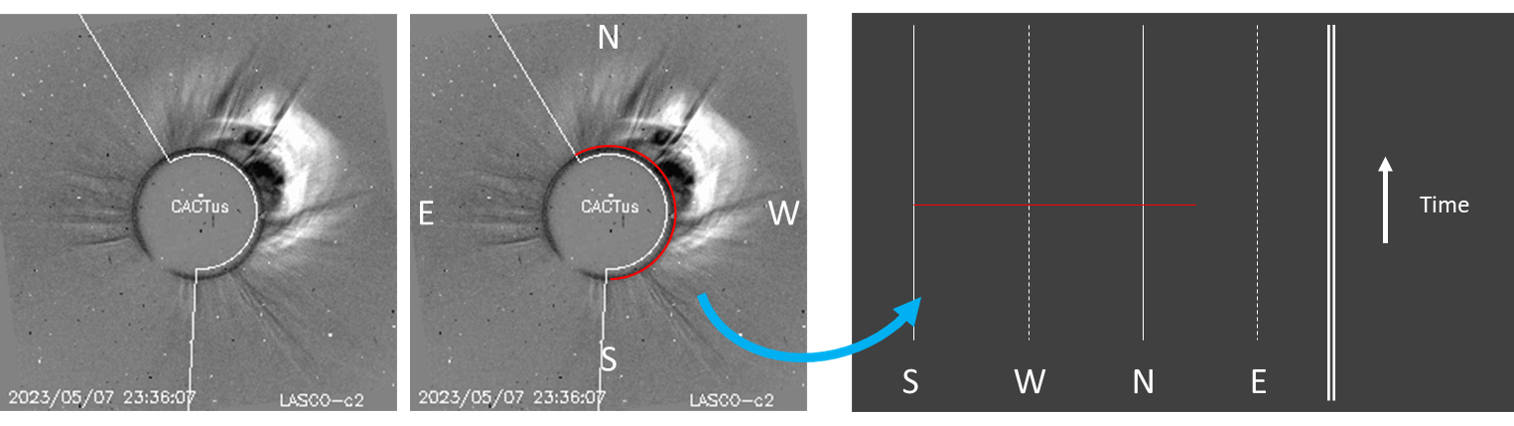
CACTus stands for "Computer Aided CME Tracking", with the "us" added for convenience. It is a software package that has been developed by the SIDC about 2 decades ago (Robbrecht and Berghmans, 2004) and autonomously detects CMEs in image sequences from SOHO/LASCO C3. Based on difference images (i.e. one image subtracted from the next), and using some clever algoritms, it detects brightenings in the images that are radially moving outward (away from the Sun) through the field of view of the coronagraph. The detected patterns can then be put on a map, with the location laid out horizontally (South-West-North-East, so counter-clockwise) and time vertically - See the simplified sketch underneath. The colours are arbitrarily chosen and used to distinguish the different CMEs from each other. The "thickness of each "blob" indicates how long the outflow of the CME takes.
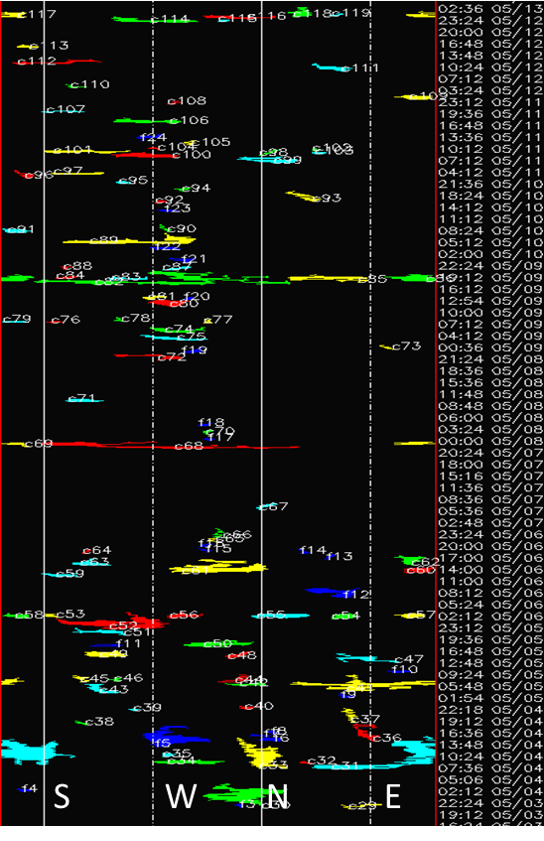
The output of the software is a list of events, similar to the classic catalogs, with principal angle of propagation, angular width and velocity estimation for each CME. These data can be accessed by clicking on the coloured CME on the map (near real-time, i.e. almost as soon as the SOHO imagery is received). The CME list is automatically generated by CACTus, meaning no human intervention or supervision is required. Nonetheless, detections have to be examined carefully, as sometimes, it is not easy to distinguish multiple CMEs close to each other, which the system may then erroneously combine or split up. Therefore, the use of the CACTus data are to be used with some caution when used for statistical purposes. The map underneath shows the results for the period from 3 till early 13 May. According to CACTus, there were on the average about 9 CMEs daily during the first 13 days of May. This is quite a bit higher than the average CME-rate for the first 4 months of 2023, where it was around 6 per day. Of course the month of May still has over 2 weeks to go, which may reduce the current average. An example of a comparison between a period of maximum activity and one of minimum activity during the previous solar cycle can be found in this STCE newsitem.