
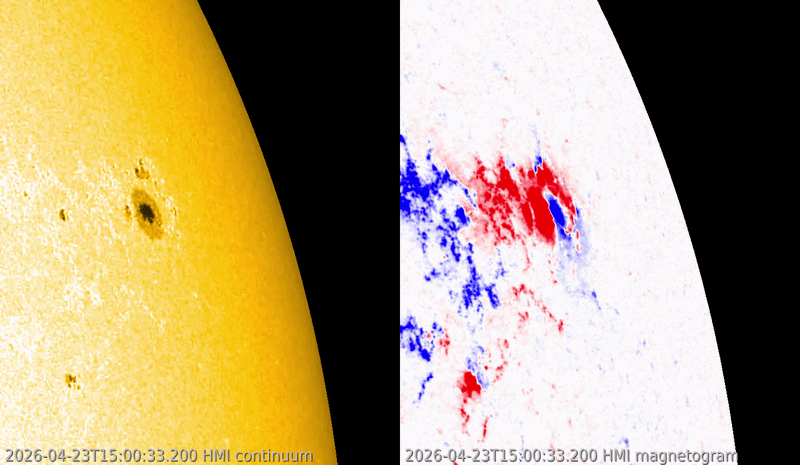
SIDC Sunspot Group 825 (NOAA Active Region 4419) was all in all relatively quiet until 23 April, when it started to add sunspots to its north and west. This can be seen in the SDO/HMI white light imagery underneath (huge zoom). The magnetic fields seemed to be more complex for the sunspot portion north of the main spot, but so close to the solar limb, the line-of-sight effects make it hard to tell. The red and blue colours represent areas of respectively positive polarity (field lines coming out) and negative polarity magnetic fields.
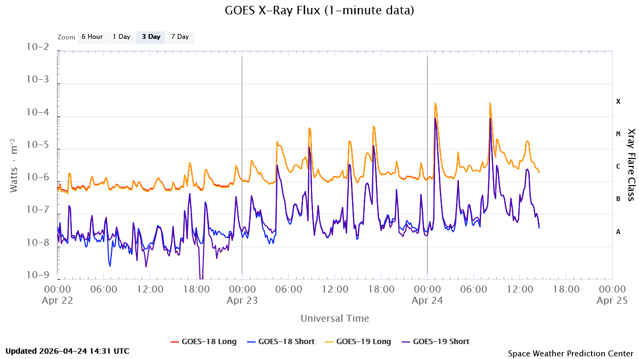
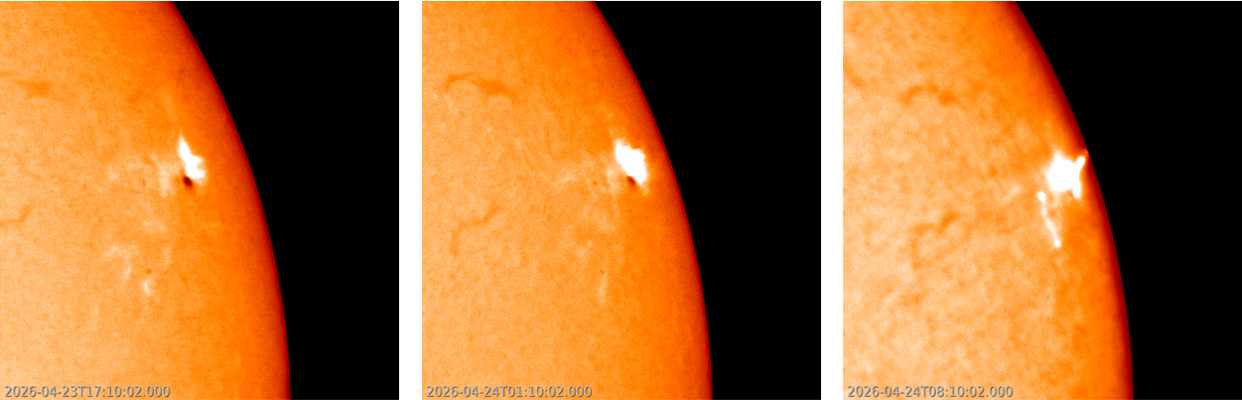
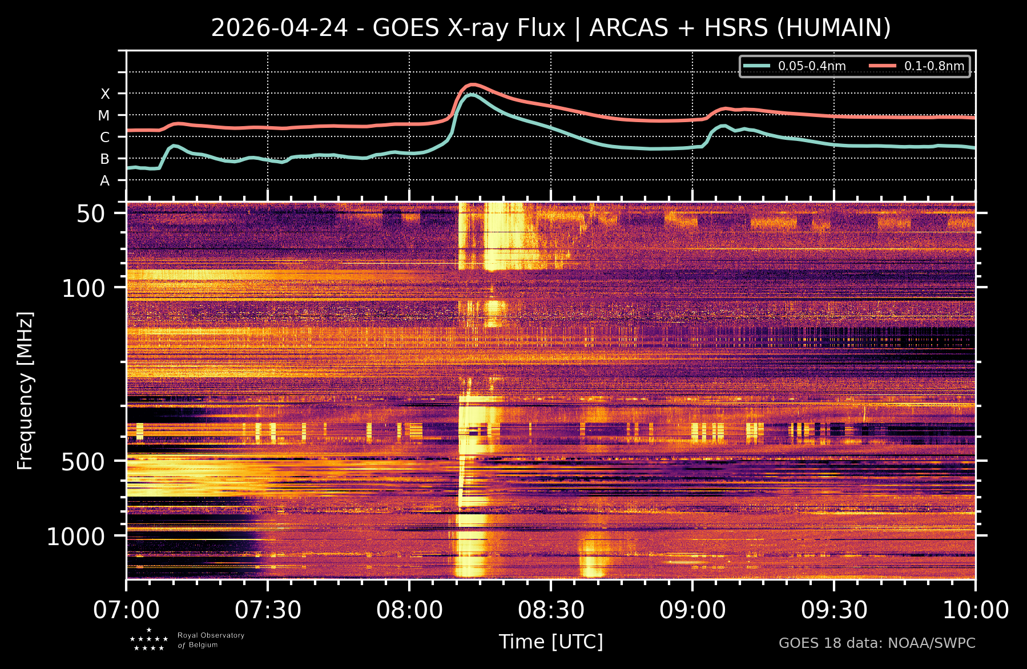
The emergence of these new sunspots resulted initially in the production of M-class flares (flare classification) on 23 April, the strongest being an M4.9 flare peaking at 17:08UTC. This enhanced flare activity was then followed by the two X-class flares on 24 April: An X2.4 flare peaking at 01:07 UTC, and an X2.5 flare peaking at 08:13 UTC. These flares are clearly visible in the GOES chart underneath. The subsequent compilation shows the location and size of the 3 flares in H-alpha (red portion of the solar spectrum at 656.28 nm; GONG). All three flare events are located to the northwest ("upper right") of NOAA 4419's main spot, with each eruption stronger than the previous one.
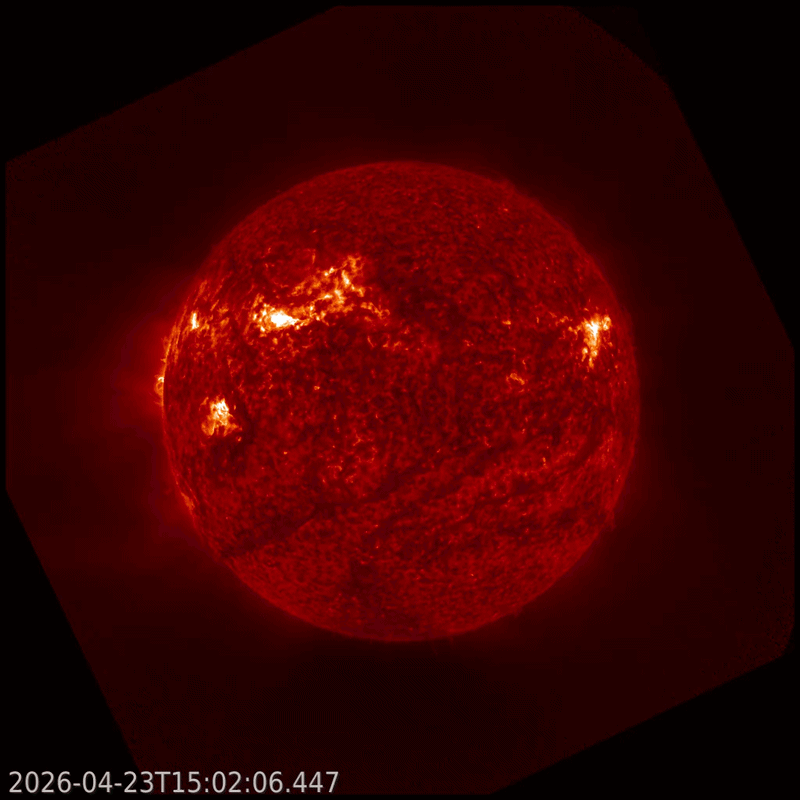
The clip underneath shows the solar activity from 23/15:00 UTC to 24/11:00 UTC April in extreme ultraviolet (AIA 304), at temperatures near 80000 degrees. The eruptions are complex, and material is clearly ejected into space.
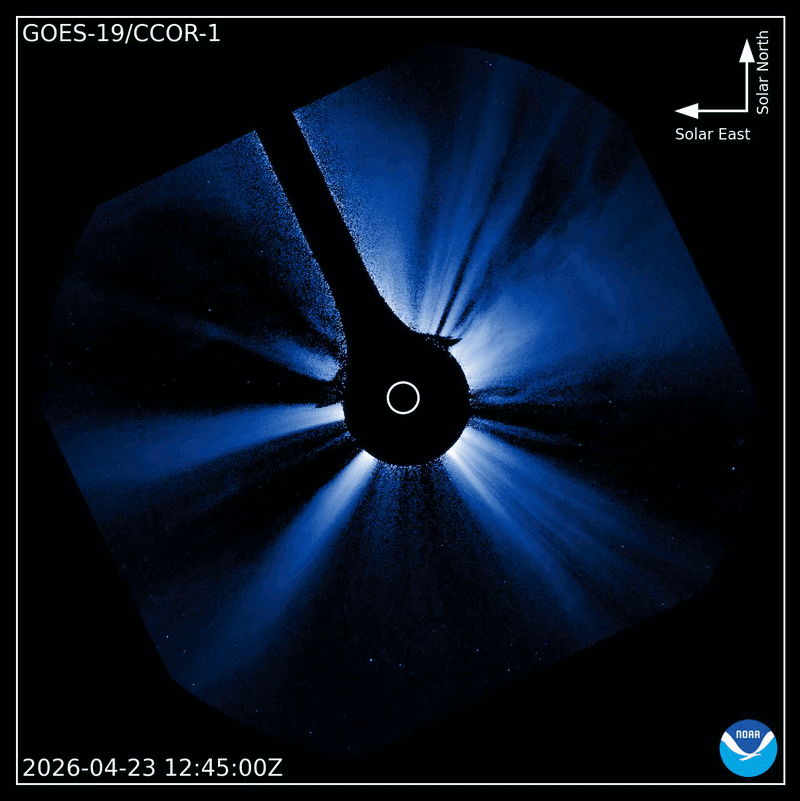
The coronagraph on board GOES (CCOR-1) had a good view on the 3 associated coronal mass ejections (CME ; magnetic clouds of charged particles). They can be seen in the clip underneath, covering 23/15:00 UTC to 24/11:00 UTC April. The excessive light in the images between 04:00 and 06:00 UTC is reflected sunlight from the Earth as it passed through CCOR-1's field of view. At the end of the clip, comet PanSTARRS (C/2025 R3) enters the field of view from the right. The bulk of these CMEs is directed away from the Earth, but an earth-directed component cannot be excluded at this time. Standing-by the analysis results from the SIDC space weather forecaster. A CME associated with preceding flare activity is thought to arrive late on 26 April, potentially resulting in a minor geomagnetic storm.
The radio signature of the second X-class flare was also observed by the Humain Radioastronomy Station in Belgium, as can be seen in the radio spectrogram underneath. The horizontal axis represents time increasing from left to right and the vertical axis represents frequency (in MHz) decreasing upward to represent the decreasing density with increasing altitude in the solar atmosphere. The evolution of the solar soft-x-ray flux (GOES) is displayed on top of the spectrogram.
Radio observations by the NOAA/USAF network revealed that all 3 flares discussed above were associated with a Castelli-U burst (or U-burst for short). It was named after John Castelli, a military in the USAF (United States Air Force) who worked extensively in the radar and radio domain during World War II and in the 1950-70’s. This "Castelli-U spectral burst" is characterized by a U-shape in a graph depicting the intensity of the burst vs. the observed radio frequencies, i.e. the highest intensities are usually found at frequencies below +/- 1000 MHz and above a few thousand MHz, and a dip in-between (Castelli et al. 1967 ; Castelli et al., 1977). This can be seen in the graph below showing all three flare events, based on data from the NOAA/USAF network. The Castelli-U feature requires a specific set of conditions, usually only satisfied with strong flares (see e.g. Chertok et al. 2009 ; Grechnev et al. 2008). Details, conditions, and further explanations can be found at https://www.spaceacademy.net.au/env/sol/solradp/solradp.htm (at the bottom of the page).
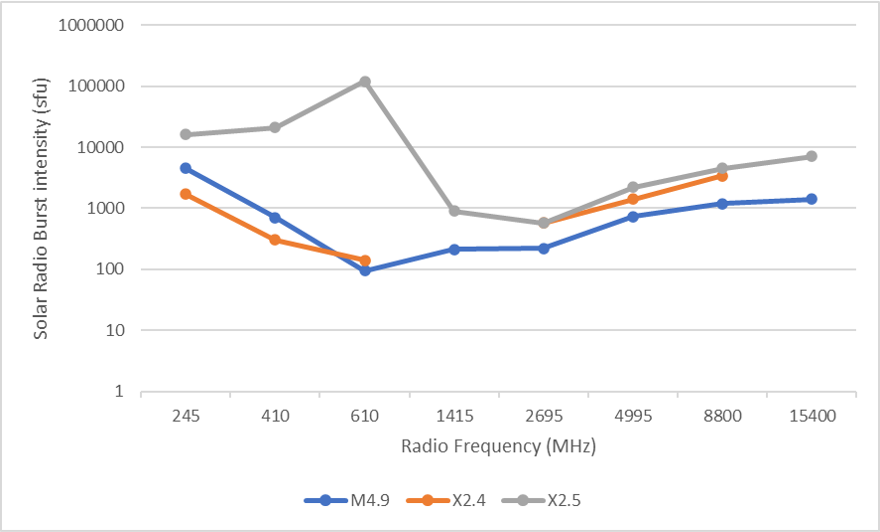
Castelli-U bursts were used for predictions of proton events (See https://www.spaceacademy.net.au/spacelab/models/ppm.htm ; Kiselev et al. 2022), but even today -especially when associated with important Type II and Type IV radio bursts- it is sometimes still considered as an indication of a pending proton event. Alas, the greater than 10 MeV proton flux (GOES) has basically remained at background levels for all 3 eruptions. Nowadays, it is also useful in the sense that a U-burst often means that GNSS frequencies (1.1-1.6 GHz ; Global Navigation Satellite Systems such as GPS and Galileo) were amongst the least affected by the eruption, compared to the lower and higher frequencies. Of note is that for the strongest of the 3 events (radio burst associated with the X2.5 flare - chart above), the intensity at 610 MHz reached 120000 sfu. This is not a record-breaking value, but still important enough that it may have impacted some radar or communication applications for a short while.
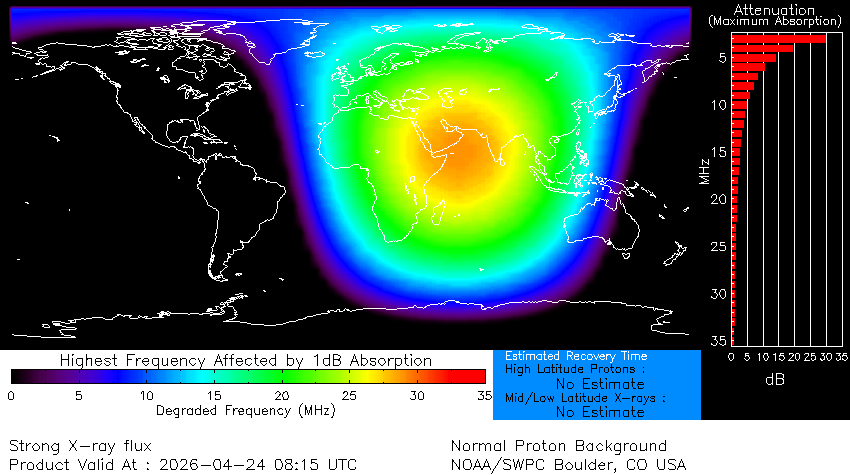
The ionizing radiation of the X-class flare itself affected the lower frequency portion of the High Frequency communication band (HF Com ; 3 - 30 MHz) on the dayside of the Earth. During the first X-class flare, this was mainly over the West-Pacific Ocean and near Japan, East- and South-East Asia, and Australia. The second X-class flare may have affected HF Com over the Persian Gulf, Iran, Saudi-Arabia, the Horn of Africa, India, and the northern portion of the Indian Ocean. The effects of the second X-class flare on HF Com can be seen in the D-RAP (NOAA/SWPC) map above. Advisories to civil aviation have been issued (PECASUS).
