
Over the last 2 weeks, eruptions from NOAA 4274 (SIDC Sunspot Group 687) have determined space weather conditions. This active region produced no less than 5 X-class flares, amply discussed in related STCE newsitems. So, it seems time to provide an overview of the eruptions and associated characteristics. Please note that some of these numbers are preliminary (e.g. Dst index), or have been somewhat averaged (e.g. the GLE % of the neutron monitors).
Table 1
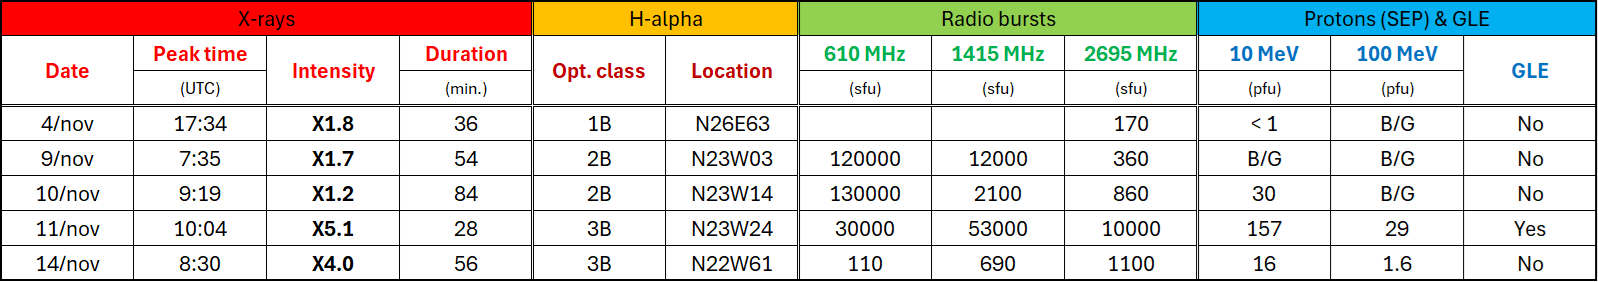
- In the first table, the first 4 columns provide details of the time, intensity and duration of the 5 X-class flares (GOES). The strongest flare was the X5.1 event on 11 November, but the X-class flare with the longest duration took place on 10 November and lasted 84 minutes, a so-called long-duration event (LDE).
- The optical class (NOAA/SWPC) provides info on the size (area) and brightness of the eruption in H-alpha, as explained at https://www.stce.be/educational/classification#optical "SF" is the smallest and faintest type of flare, "4B" the largest and brightest event. Also the location of the flare can be deduced from H-alpha observations, which is not possible from GOES x-ray flux data. NOAA 4274 was located in the northern (N) solar hemisphere, and moved from the eastern (E) into the western (W) solar hemisphere.
- The next 3 columns provide information on the intensity of any associated radio burst (NOAA/USAF). The 3 frequencies displayed were chosen for various reasons. GNSS frequencies (Global Navigation Satellite Systems, such as GPS or Galileo) may be affected if strong radio bursts occur near 1415 MHz, in particular if the intensity is over 10000 sfu. The frequency of 2695 MHz was chosen because it is close to 2800 MHz, a frequency corresponding to the 10.7 cm radio flux which is often used as an input parameter for the calculation of the satellite drag. Finally, the 610 MHz frequency was chosen because the highest intensities during the eruptions from NOAA 4274 were recorded at this frequency.
- The last 3 columns provide particle fluxes for protons with energies greater than 10 MeV and 100 MeV, and if a Ground Level Enhancement (GLE) was recorded. These fluxes concern the peaks induced by the solar eruptions (SEP - Solar Energetic Particles event), thus not caused by the passage of the associated coronal mass ejections. Then they are called ESP ( Energetic Storm Particle event) which -if any- are given in Table 2. See this STCE newsitem for more details on SEP and ESP.
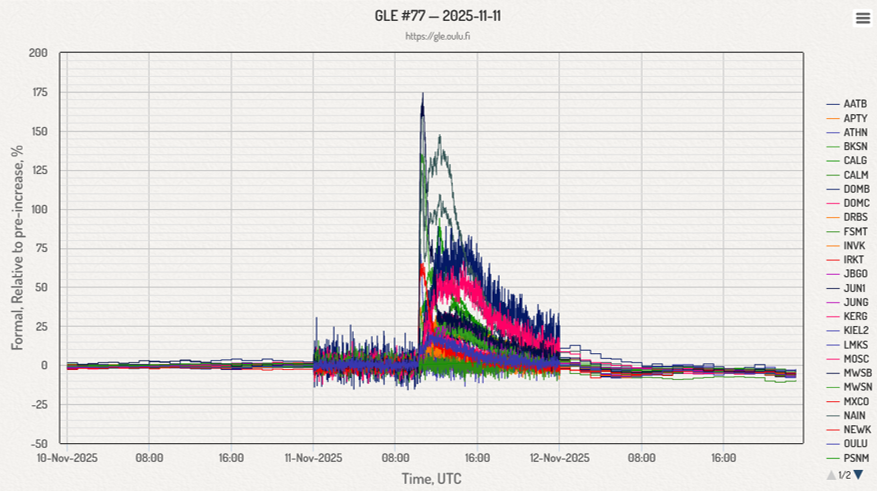
- The GLE associated with the X5.1 flare is the largest of the 5 GLEs recorded so far this solar cycle, with the greater than 500 MeV proton flux, i.e. the driver behind these enhancements, being a factor 7 to 10 larger than the flux from the previous GLEs. The resulting percentage increase in neutron counts was up to 75%-150% at some locations (chart), compared to only about 10% from the second strongest GLE on 11 May last year (see the website of the University of Oulu). We have to go back until 13 December 2006 to find a GLE of similar intensity.
The table is followed by a plot combining the x-ray evolution with the proton flux, covering the period from 9 to 15 November (SWPD/SWx TREC). The proton flux increases on 10, 11 and 14 November are associated with the X-class flares (SEP), whereas the brief spikes early and late on 12 November (ESP) are due to the passage of the CMEs related to the 10 and 11 November X-class events.
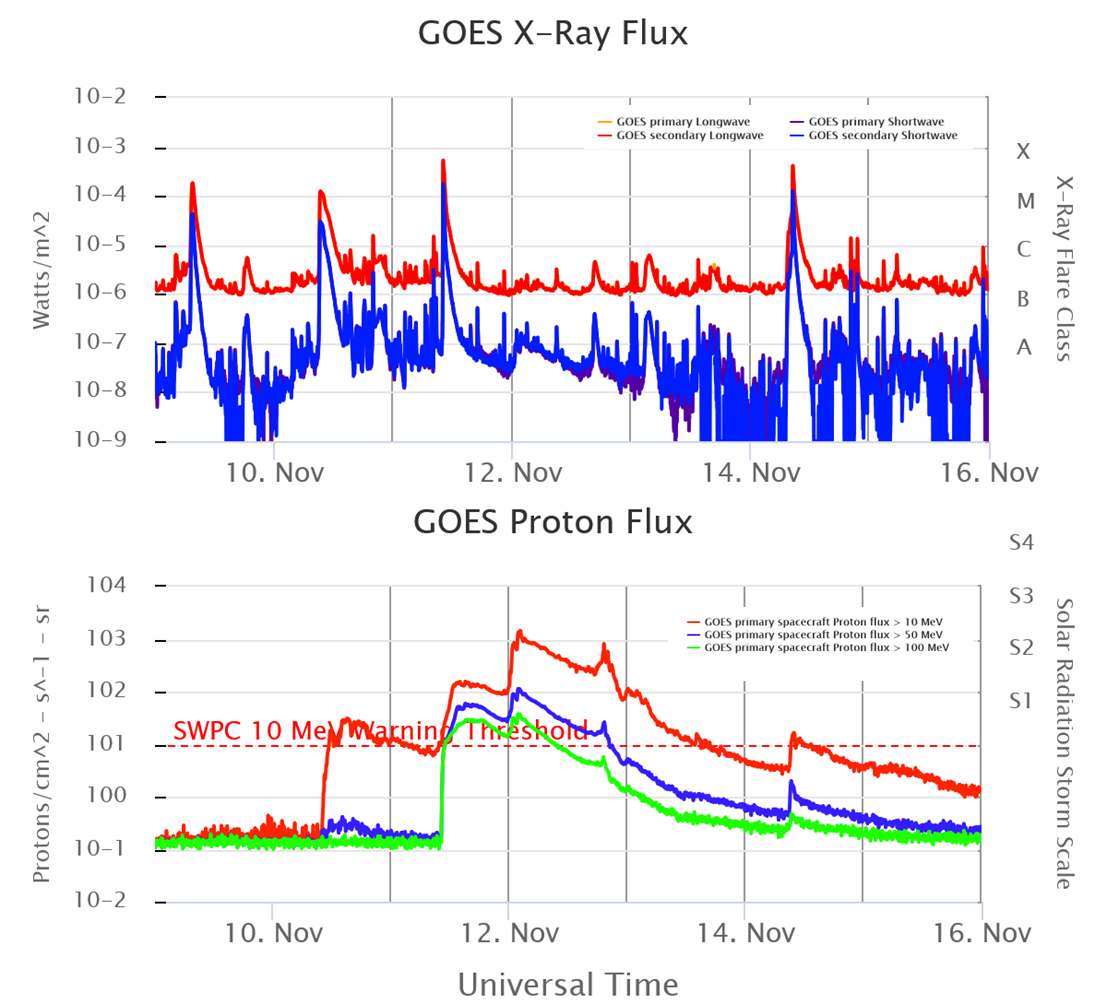
Table 2
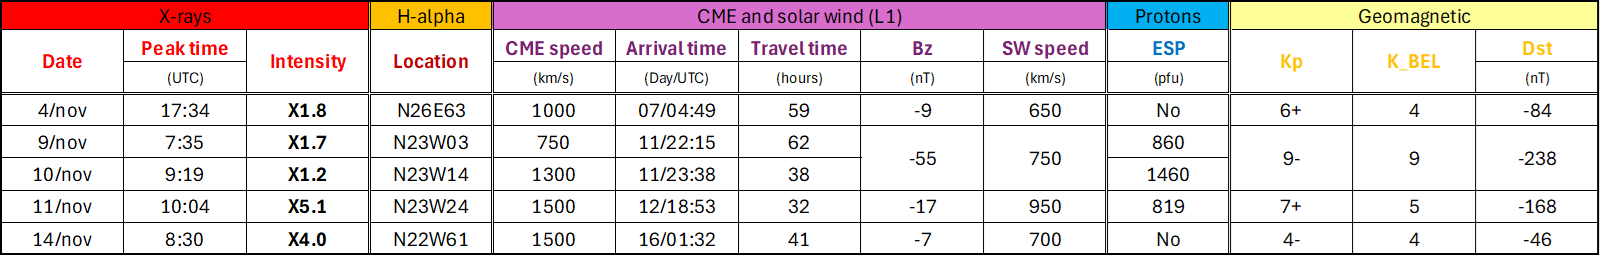
- In the second table, the first 4 columns repeat info from the X-ray and H-alpha events, just to make clear which X-class flares we are talking.
- The next 5 columns provide info over the associated CME: its speed as it departed from the Sun (SIDC), and the solar wind characteristics as this interplanetary CME passed the L1 point (location of DSCOVR and ACE). These include the time of arrival (UTC), travel time (hours), the most negative excursion of Bz (the north-south component of the interplanetary magnetic field), and the (averaged) maximum speed. There was no Fast Transit Event observed, i.e. no CME covered the Sun-earth distance in less than 24 hours. The next column provides information on the greater than 10 MeV proton flux induced by the passage of the CME ("ESP").
- The last 3 columns provide geomagnetic information: the maximum observed Kp and the local K index for Belgium (K_BEL), as well as the minimum observed Dst (see the STCE SWx classification page for more information on these indices).
- Note that the Bz value of -55 nT that eventually would result in the severe geomagnetic storm on 12 November (Kp = 9-) is slightly stronger than the -50 nT recorded during the May 2024 storm. However, the latter storm remained much longer at this value, and was thus able to create an extremely severe geomagnetic storm (Kp = 9o). The solar wind speed of 950 km/s is unusually high -even for a CME passing the Earth- and is comparable to the speed of the May 2024 CME. The Dst index reached a minimum value of only -238 nT, much weaker than the -406 nT registered during the May 2024 storm.
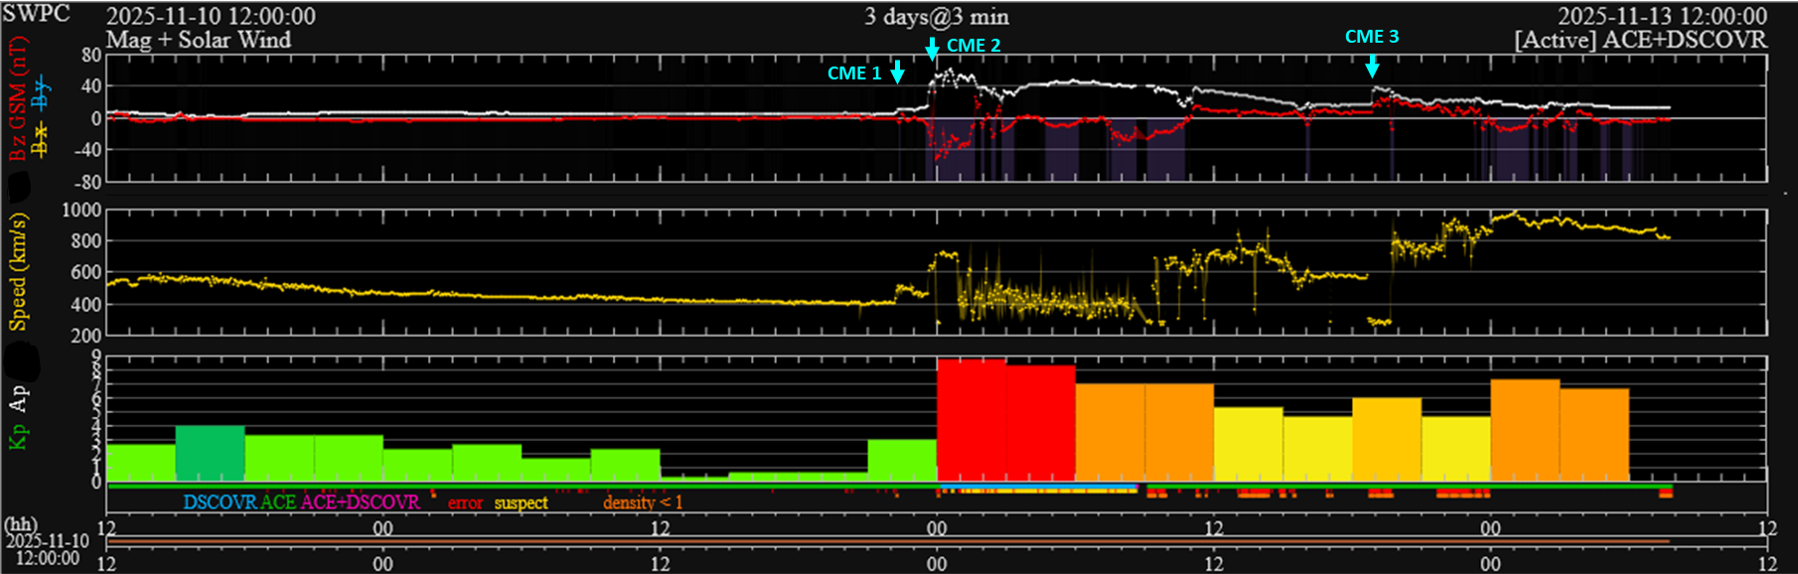
The evolution of the solar wind parameters and Kp index is shown in the charts underneath. The coronal mass ejection (CME) related to the X5 flare from 11 November arrived at the DSCOVR spacecraft on 12 November at 18:53 UTC ("CME3" in the annotated chart underneath). The solar wind speed increased to values around 950 km/s, significantly faster than "CME2" which was the source of the severe geomagnetic storm (Kp = 9-) early on 12 November. However, the magnetic field strength of "CME3" was much weaker (39 nT vs 61 nT ; white curve) and its north-south orientation (Bz ; red curve) was mainly positive, preventing the build-up of a (extremely) severe storm. Eventually, Bz would reach -17 nT (CME 2: -55 nT !!) for a brief 2-hour period early on 13 November, resulting in "only" a strong geomagnetic storm (Kp = 7+ ; bottom panel of the chart).
Impacts
- Aurora were observed well away from their natural habitat, i.e. the northern lights were observed at middle and southern latitudes. Reports from red aurora came from Florida and Texas in the United States, and as far south as Catalonia (Spain), Austria and Switzerland in Europe. Most reports emphasized that the aurora were not as splendid as during the May 2024 storm.
- HF communications were severely disturbed over Iceland early on 12 November, coinciding with the highest proton fluxes and the main phase of the severe geomagnetic storm.
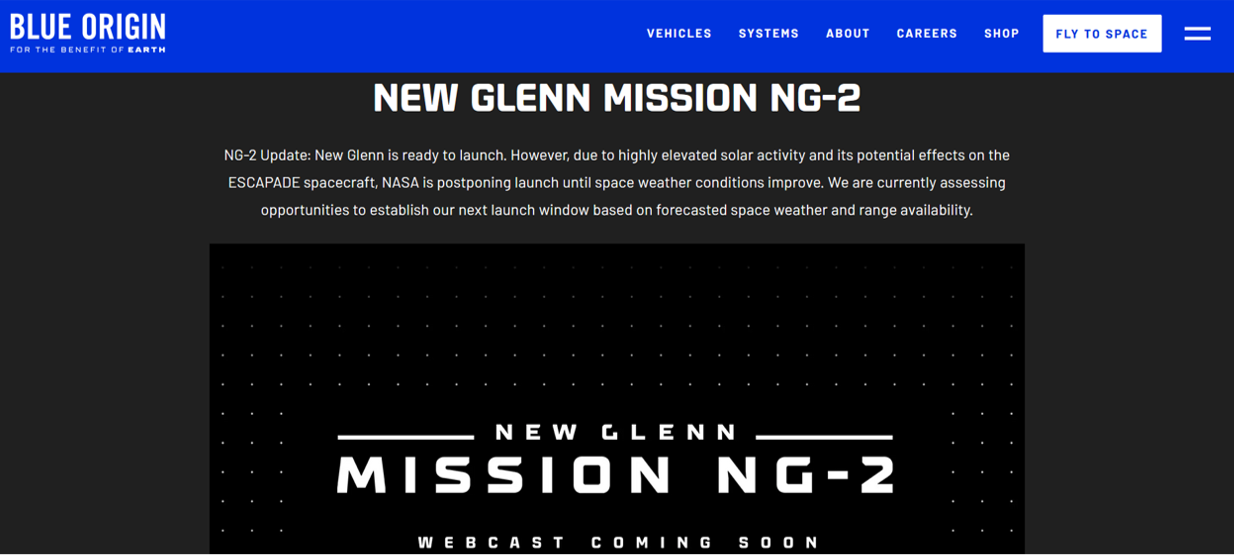
- The launch of the New Glenn mission was delayed by 1 day in view of the ongoing space weather activity and the expected powerful hit by the CME related to the X5 flare (screenshot).
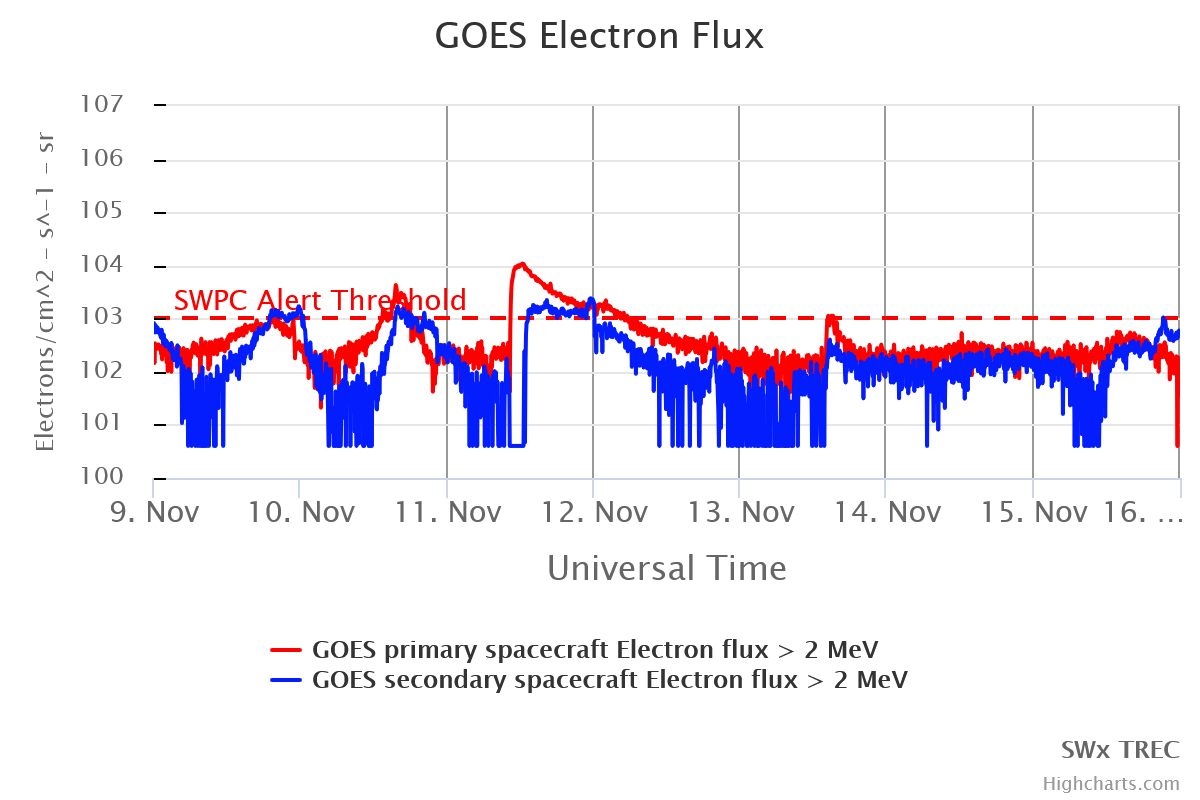
- Sensors on board some spacecraft got affected by the inclement space weather. The sensor on board GOES measuring the energetic electrons got affected by the GLE (chart). This effect was expected by NOAA/SWPC as they write on the related website "The greater than 2 MeV electron channel may be contaminated by solar energetic protons. Starting with GOES-16, this effect is due to protons with energies above several hundred MeV and is weaker than it was on earlier GOES satellites. However, as of December 2024, this effect has not been quantified during a large S3 or S4 solar proton event." It looks like the 11 November GLE offers a fine case for study. Also the sensor recording solar wind speed, density and temperature on board the DSCOVR and ACE spacecraft was affected soon after the second, most powerful CME struck late on 11 November. SOHO/CELIAS solar wind data were not affected.
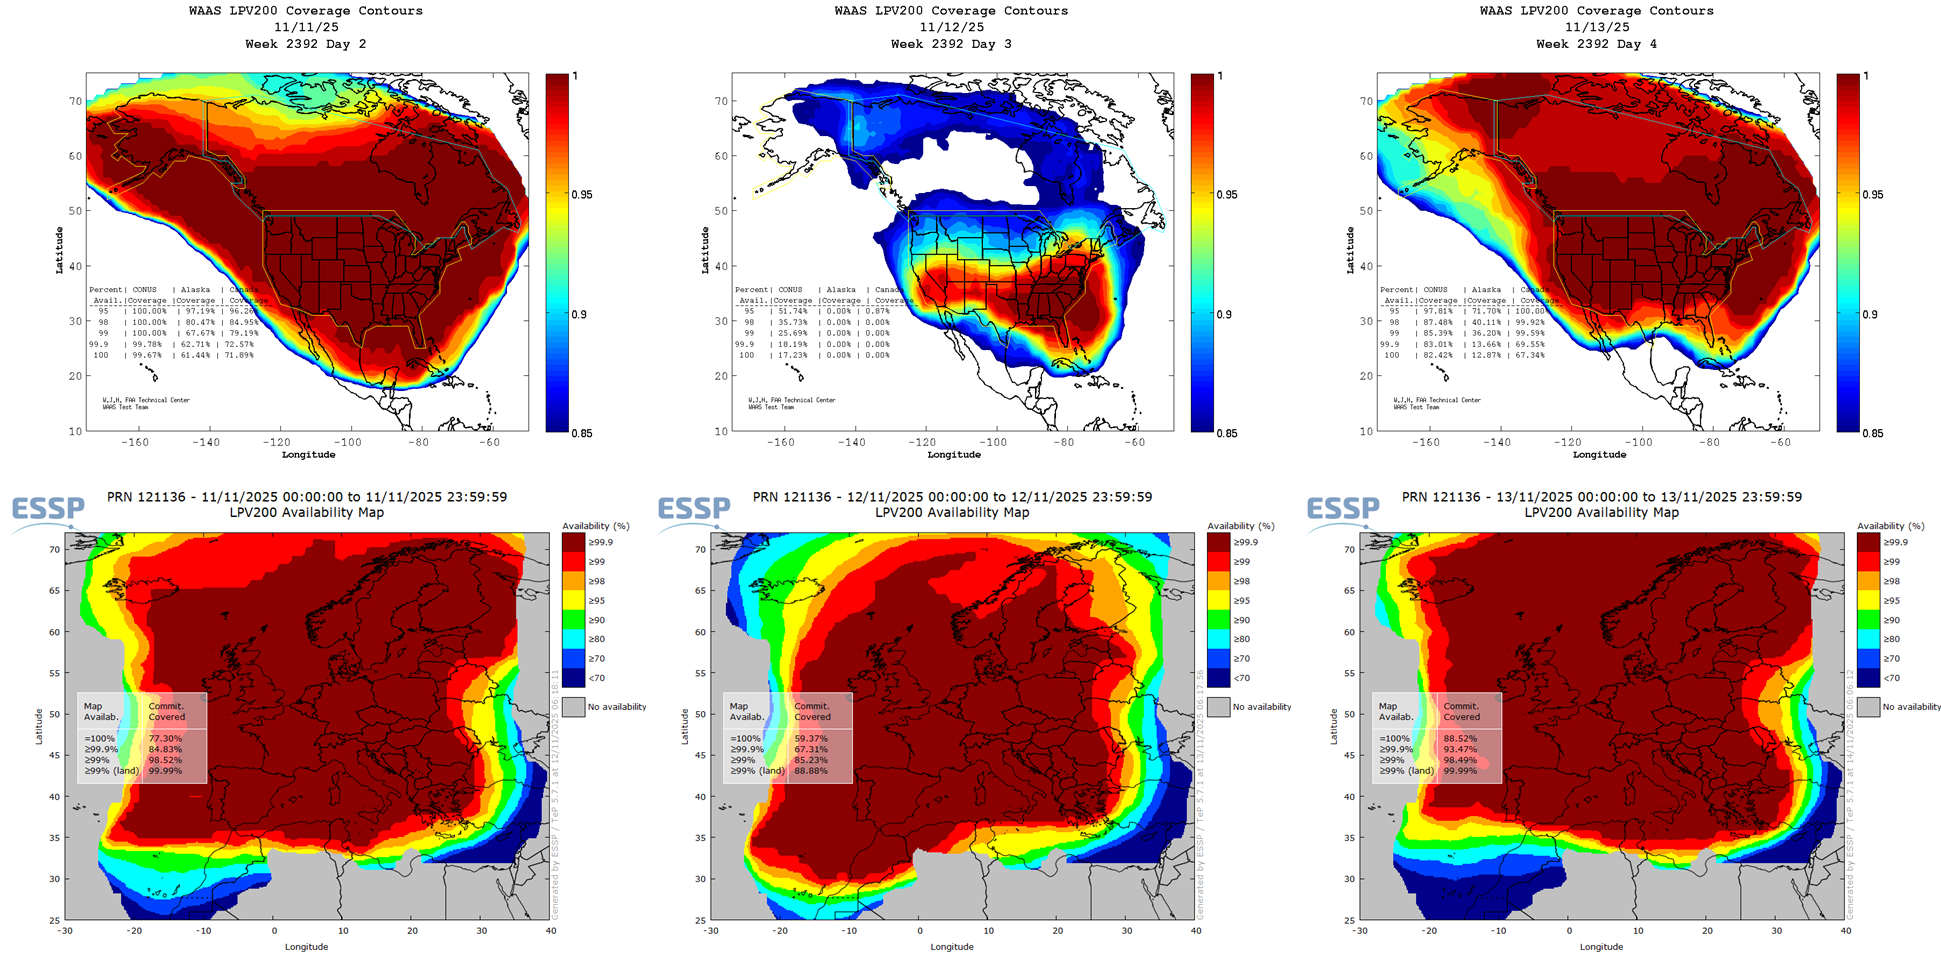
- Certain GNSS applications (Global Navigation Satellite Systems, such as GPS and Galileo) were disturbed. This was for example reflected in the reduced availability of some GNSS-based aviation tools, such as LPV200 - the vertically-guided landing approach aid for airplanes to as low as 200 feet (61 meters) above ground level (WAAS , Canada and United States ; EGNOS , Europe ; STCE newsitem for more info). A brown colour is good availability, blue means significantly degraded. The effect was especially pronounced for WAAS, as can be seen in the top row of the graph underneath covering 11 to 13 November. However, the perturbation was not as strong as during the May and October 2024 storms when WAAS was not available at all for several hours. Standing-by for reports on impacts such as on farmers or drones.
