
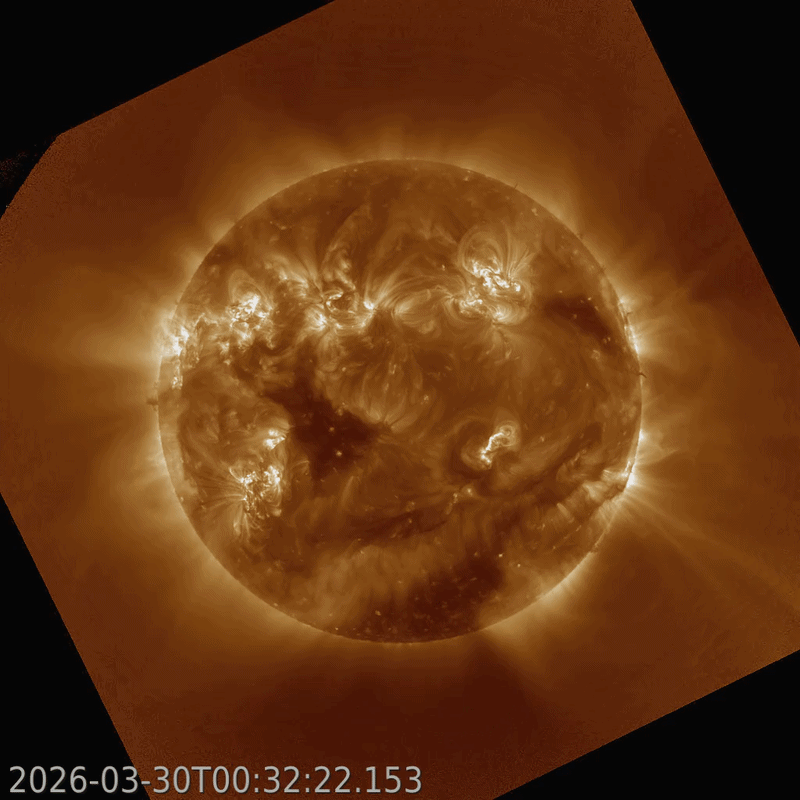
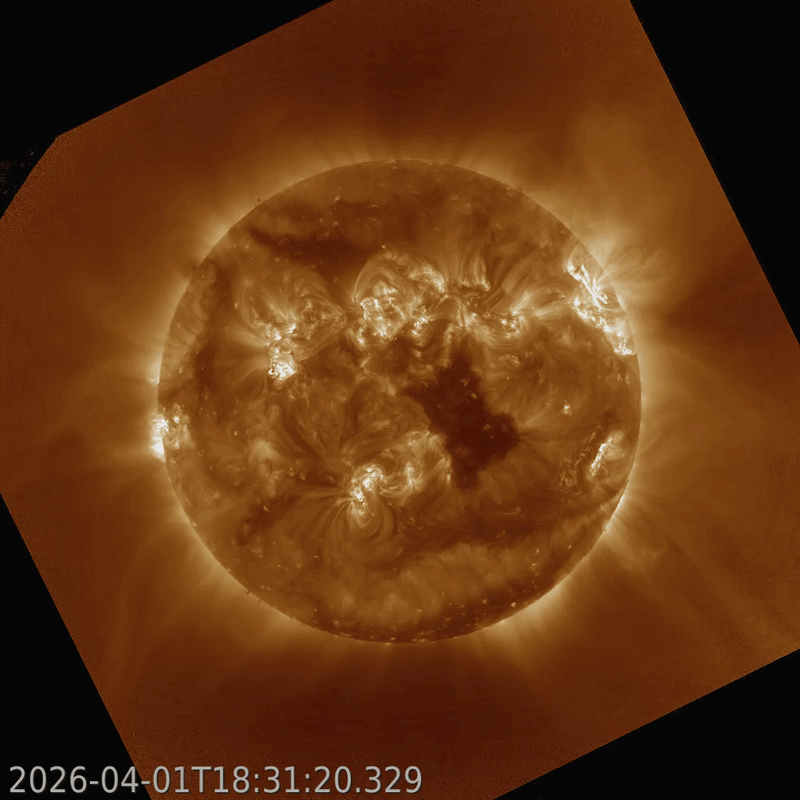
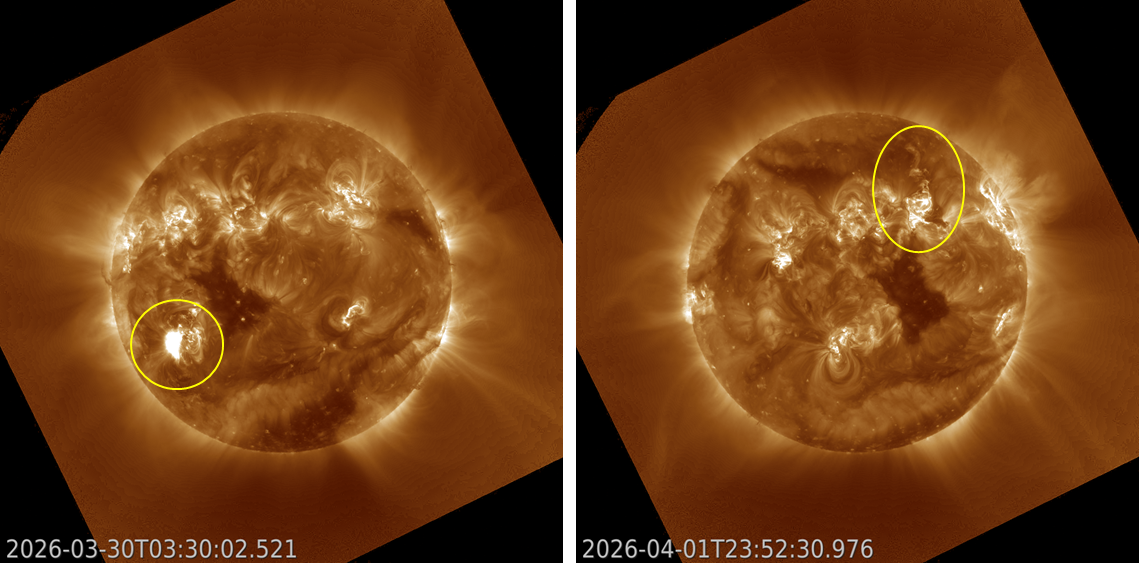
Last week, the Sun launched 2 coronal mass ejections (CMEs, i.e. magnetic clouds filled with charged particles) towards the Earth. The first CME was associated with a strong X1.4 flare that peaked at 03:19 UTC on 30 March. It was produced by active region NOAA 4405 (SIDC Sunspot Group 836) - as discussed in this STCE newsitem. The eruption is shown in the extreme ultraviolet (EUV) images by GOES/SUVI 195 underneath left. The other CME was related to a filament eruption late on 1 April which was associated with a C-class flare. Solar filaments are clouds of charged particles ("plasma") above the solar surface squeezed between magnetic regions of opposite polarity. Being cooler and denser than the plasma underneath and their surroundings, they appear as dark lines when seen on the solar disk. The eruption of the filament is shown in the imagery to the right (annotated). Note that NOAA 4405 and the filament were located respectively 30 degrees east and 30 degrees west of the central meridian, i.e. the Sun's north-south line. The darkish structure near the disk's centre is a small, well-defined coronal hole, i.e. a hole in the solar atmosphere through which particles can freely escape along the open magnetic field lines into space. The magnetic field of the associated high speed stream (HSS) had a negative polarity, i.e. its magnetic field lines were oriented towards the Sun.
 |
 |
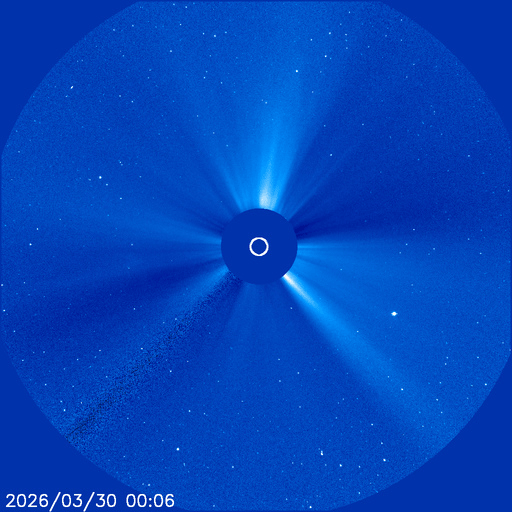
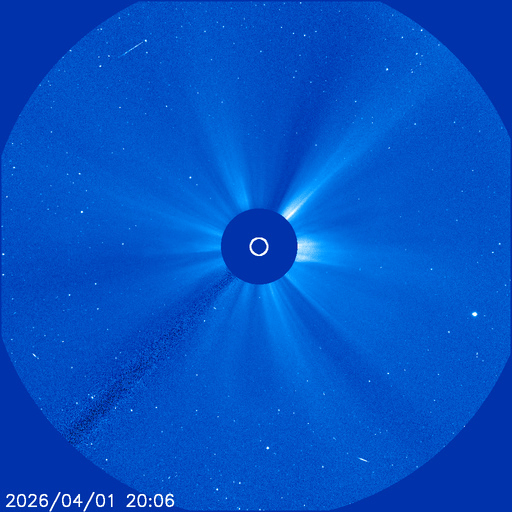
The associated CMEs are shown in the coronagraphic imagery underneath (SOHO/LASCO C3). Both are halo CMEs, meaning one can trace the faint outlines of the CME's shock all around the Sun, which is hidden behind the coronagraph's occulting disk. At the same time, it is clear that in both cases the bulk of the CME is directed away from the Sun-Earth line: the core of the first CME is directed to the southeast ("lower left"), whereas the core of the second CME is directed to the north-northwest ("upper right"). Nonetheless, most forecast centres settled for a 70-90% chance of arrival of these CMEs, and that the speed of the first CME was higher than that of the second CME, respectively about 1500 km/s and 1000 km/s.
 |
 |
Based on these parameters, the forecast centres expected an arrival time for the first CME on 31 March around 16:30UTC, and a moderate to severe geomagnetic storm (Kp ranging between 6 and 8 - see the STCE SWx Classification page). For the second CME, an arrival time on 4 April around 02:00UTC was expected, with active to moderate storming geomagnetic conditions (Kp ranging between 4 an 6) anticipated (CCMC).
The accuracy of these forecasts was mixed. Both CMEs did arrive, with in each case the passage of a shock observed in the solar wind parameters, as shown by the white (magnetic field strength) and yellow (speed) curve in the annotated chart underneath (ACE). This confirms that the bulk of both CMEs was indeed directed away from Earth. Less well predicted were the arrival time of the CMEs and the strength of the ensuing geomagnetic storm. In the first case, the relatively small shock arrived only on 1 April at 11:30UTC, that's 19 hours later than predicted and well outside the typical uncertainty margins for these forecasts. There's no smoking gun to explain this difference. As a result, there was no geomagnetic storm, and only unsettled conditions (Kp = 3 ; bar chart at the bottom) were recorded. The second CME arrived already on 3 April at 15:00UTC, about 11 hours earlier than expected. The associated disturbance of the Earth's magnetic field resulted in a strong (Kp = 7-) geomagnetic storm. So the predictions did a better job in this case, but still.
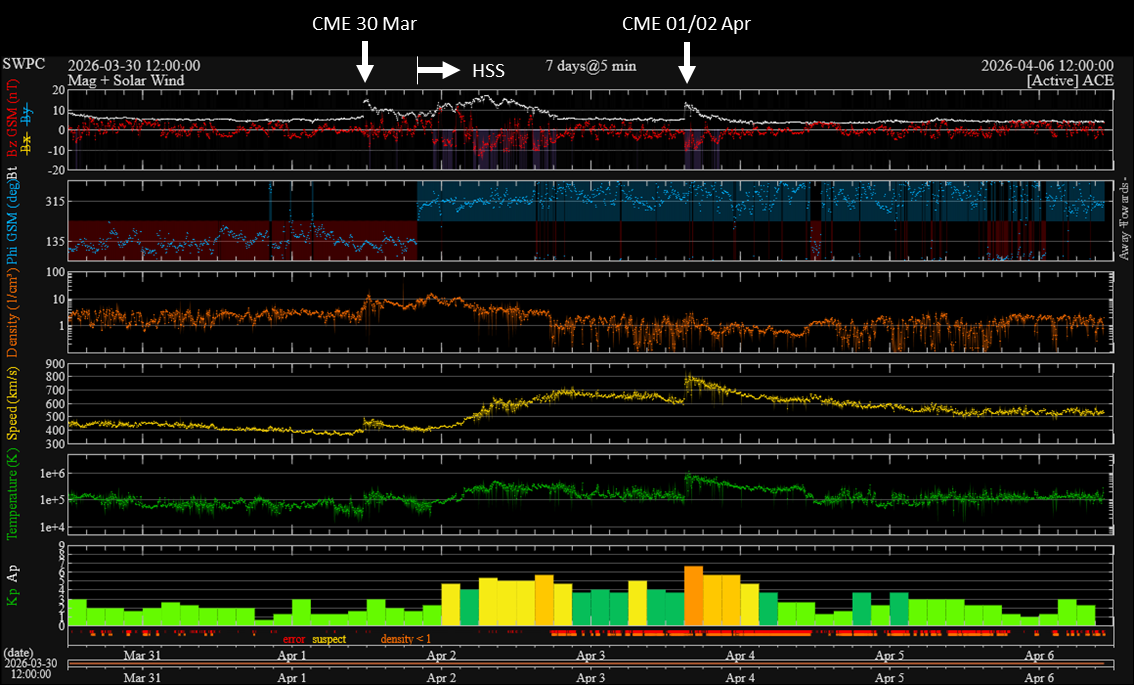
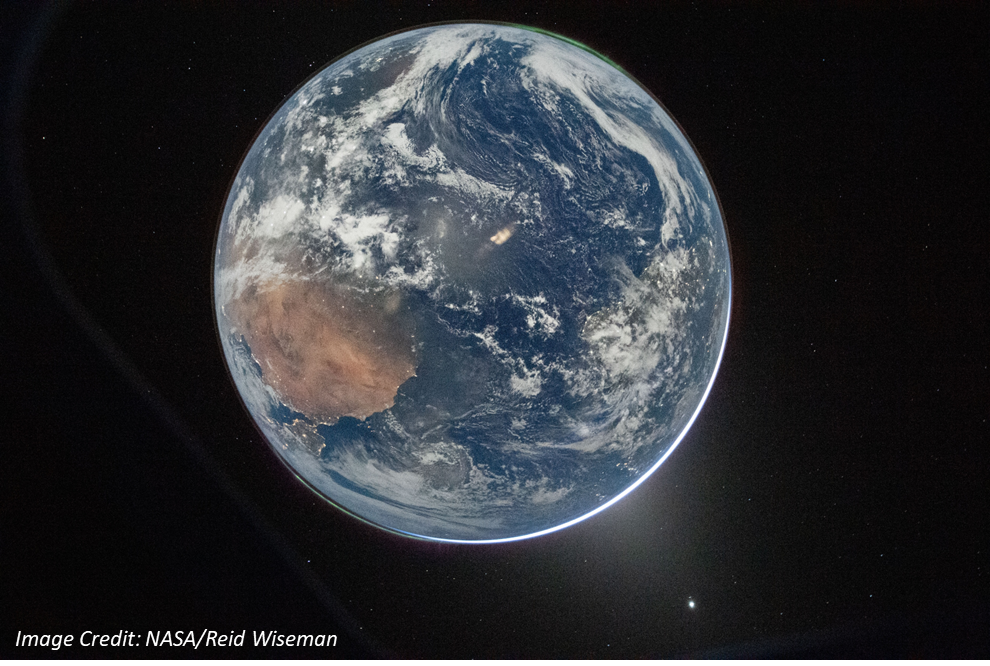
The chart above also shows the arrival of the high speed stream associated with that equatorial coronal hole mentioned before, late on 1 April. Solar wind speed reached 700 km/s a day later, and was still above 500 km/s by the end of the Easter weekend. The geomagnetic field responded with a moderate geomagnetic storm (Kp = 6-) on 2 April. The resulting aurora were actually photographed from space. NASA astronaut and Artemis II Commander Reid Wiseman took the picture of Earth underneath from the Orion spacecraft's window on 2 April. The aurora can be seen as a thin green sliver near the top and bottom of the Earth's disk. Note that the Earth is "flipped" in this image, with the northern polar light at the bottom and the southern polar light at the top. Africa is the brownish land mass to the lower left. An annotated image is provided by astronomer Dennis Mamanna (Facebook).
