On March 24 and 25, two M-flares were registered from an active region still behind the east limb. First visible in SOHO/MDI on March 25, 16:06 the group seemed to have a promising flaring future. It fell short of our expectations. But, on March 31, the giant woke up and produced a long duration event continuing for more than 24 hours!
Fragment of the Weekly SIDC bulletin (March 22-28):
"... Even before becoming visible, Catania sunspot group 93 (NOAA 10582) caused an M1.5 flare late on March 24, a few hours later followed by an M2.3 on March 25. This remained the largest flare of the week. Sunspot group 93 turned out to be a medium-sized compact group with strong magnetic fields, but its flaring activity remained much lower than expected..."
On March 30, the following message was broadcast:
"Catania Sunspot group 93 (NOAA 10582) has produced a series of large C-flares in the past 24 hours. The region has a beta-gamma magnetic topology and is approaching the solar central meridian. Therefore, we expect that this region will be driving space weather the coming days with probably more flaring activity, possibly coronal mass ejections (CMEs) and potentially enhanced proton fluxes."
Finally, the group burst open on March 31:
"NOAA AR 10582 continues producing C-class flares. The most noticeable flare was a (very) long duration flare of magnitude C3.4 and showing, in SXI movies, a clear sigmoid structure. Given these characteristics and the position (N14W15) of this active region near central meridian, it is possible that a geo-effective eruption has occurred. Up till now, no confirming data (halo CMEs or type II bursts) has however been received..."
Up till now, April 2, no CME could be detected.

The Solar X-ray Imager, simply SXI, an instrument on GOES-12 captured the long duration flare in a nice movie. The sigmoid structure is seen as an 'S' lighting up at the time of the flare. Such active regions with this 'S' structure are believed to produce easily CMEs. However, this theory is still rather controversial.
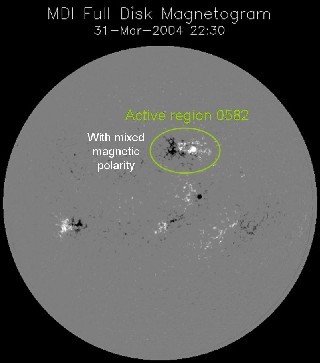
On the MDI-movie (link), one can follow the active region which changes configuration by mixing black and white. This mixing is often a sign for high activity. However, the flares after March 25 were limited to the C-level.
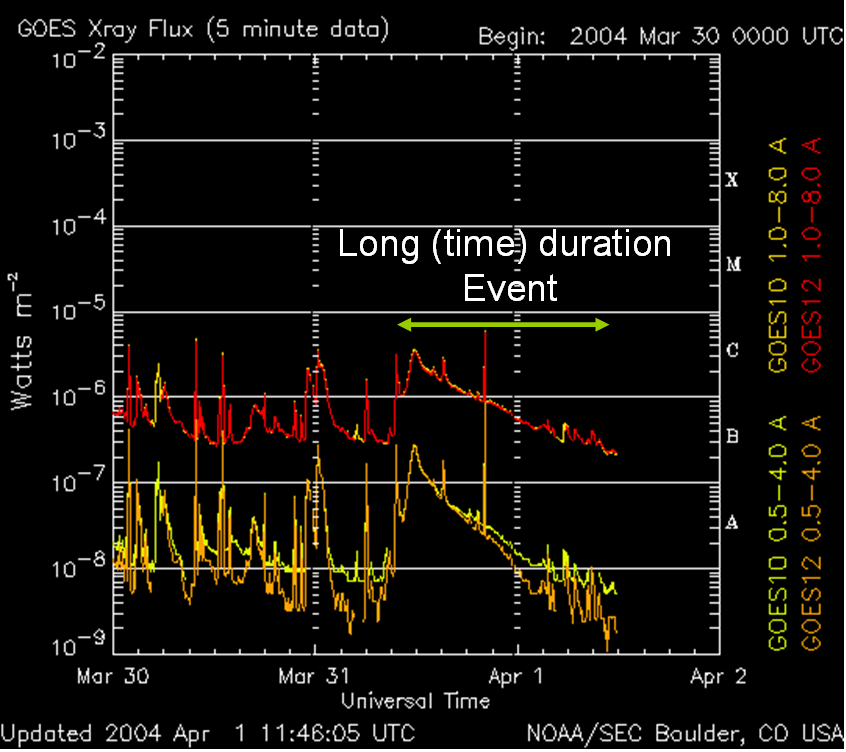
The long duration event is visible in the x-ray radiation measured by the satellite GOES. The "mountain" of x-ray radiation has a steep slope on the left. This is at the start of the event. The radiation only decays slowly resulting in this typical long duration signature.
This text is also available in Nederlands and Français.