The maximum of the current solar cycle (SC25) took place in October 2024 (SILSO). That is already 1.5 years ago, with the smoothed monthly sunspot numbers declining since then. This does not mean that there can't be any more complex sunspot groups and strong solar flares during this solar cycle!
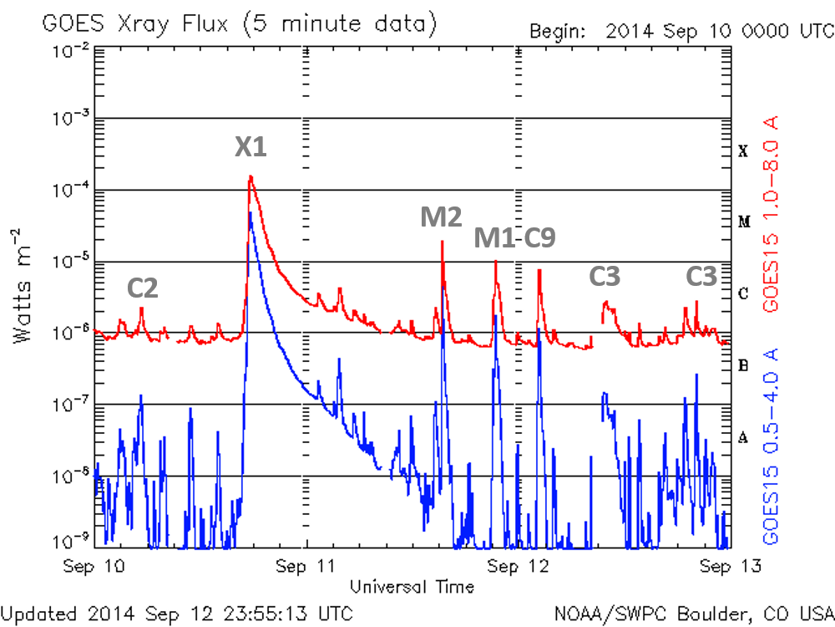
Solar flares can be ranked according to the peak energy output in soft x-ray (see annotated graph above). These measurements have been systematically carried out since 1976 by the GOES satellites in the wavelength band from 1 to 8 Angstrom (0.1-0.8 nm). The scheme uses the letters A, B, C, M, and X, with C, M, and X standing for small (or "Common"), Medium, and large (or "eXtreme") flares. The range is logarithmic, each class being 10 times stronger than the previous one, and within each category ranging from 1 to 9 (e.g. a C9 flare, an M3 flare,...). The strongest flares so far in SC25 were an X9.0 flare produced by NOAA 13842 on 3 October 2024, an X8.7 produced by NOAA 13664 on 14 May 2024, and an X8.1 flare produced by NOAA 14366 on 1 February 2026. More details and a table with the Top 10 of strongest flares so far in SC25 can be found on the STCE's SC25 Tracking webpage.
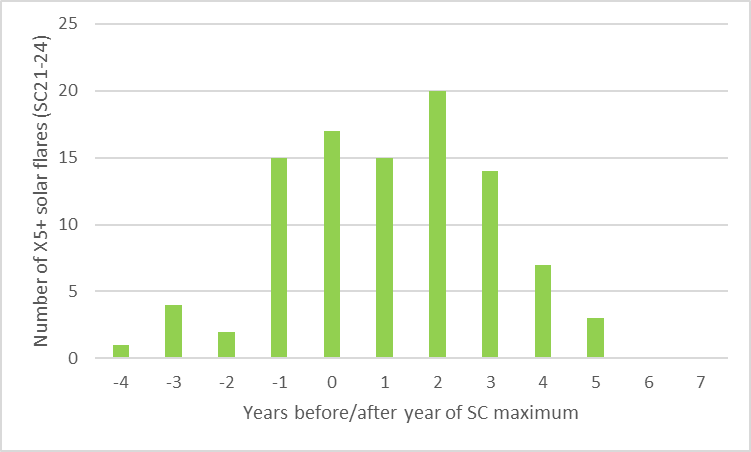
The GOES satellite fleet has been observing solar flares since 1976, so over the last half century. Analysis of the really strong flares -taken here to be X5 or stronger- indicates that most of these strong solar flares do not happen around the time of solar cycle maximum, but rather during the declining phase of the solar cycle. The graph above covers solar cycles 21 to 24. The horizontal axis indicates the time in years with respect to the solar cycle maximum. On the vertical axis is the total number of X5 (or stronger) flares summed over the 4 solar cycles. So, for the year "0", i.e. the year of solar cycle maximum, the green column indicates the number of X5+ flares that occurred from a half year before to a half year after the month with the maximum smoothed sunspot number. For the year "-1", it's the total number of X5+ flares that took place from 0.5 to 1.5 years prior to the cycle maximum, and so on. Clearly, there's an abundance of strong solar flares in the year "2" after solar cycle maximum, even lingering into year "3". For the ongoing SC25, this year "2" still has to start, running from May 2026 until April 2027! It's difficult to say how many can be expected, because there's a large cycle-to-cycle variation. On the average, 5 X5+ flares can be expected during year "2", which would be more than the 4 X5+ flares already recorded during the year "0" of SC25.
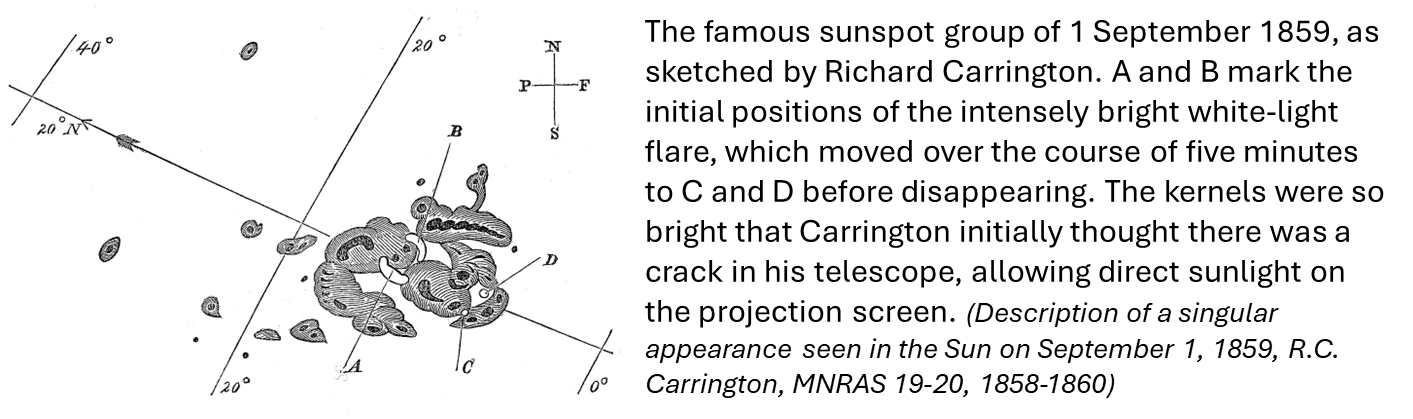
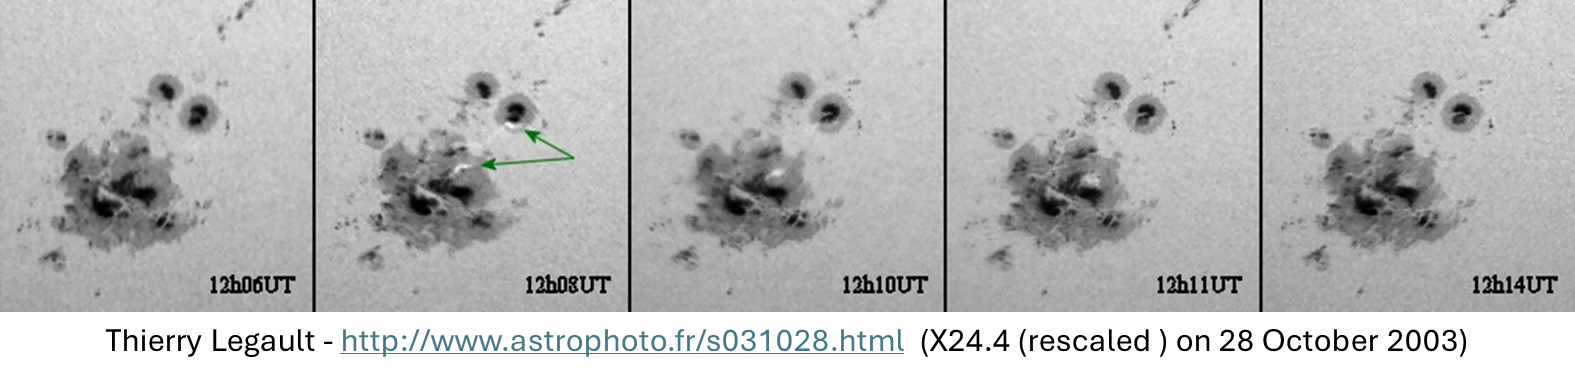
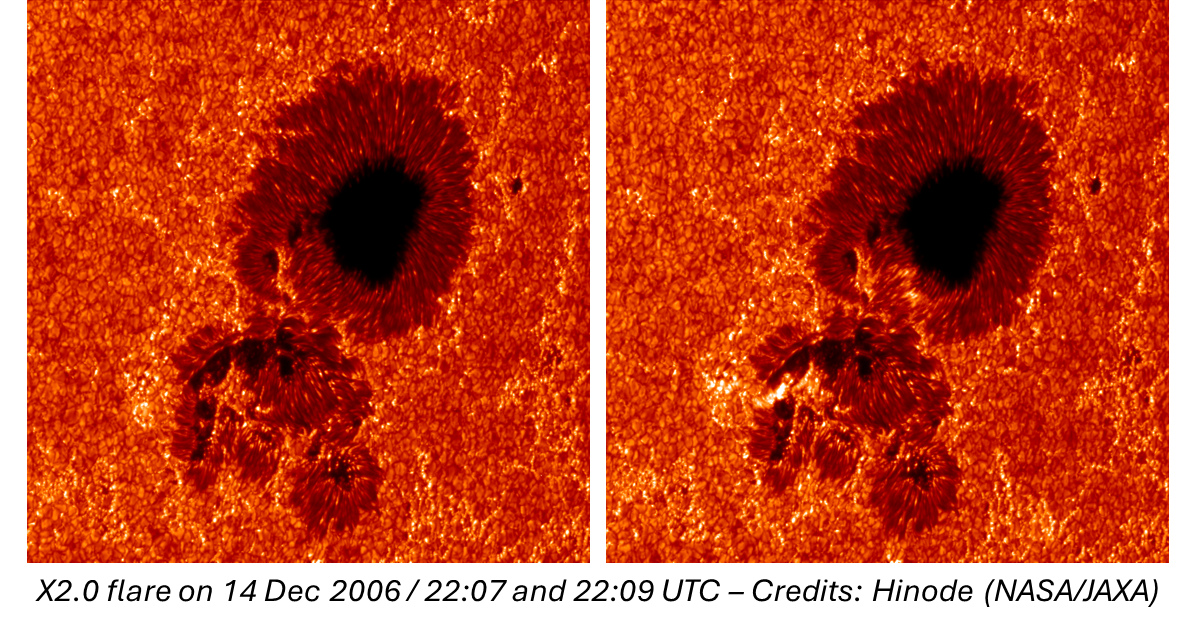
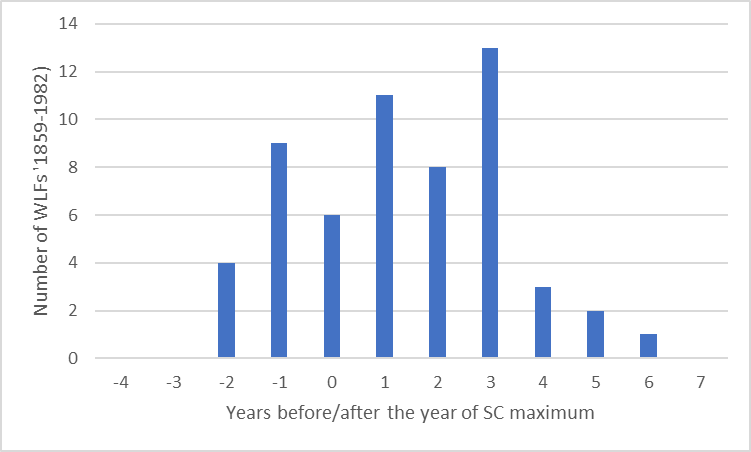
The abundance of strong flares during the declining phase of the solar cycle is not a surprise, following studies from white-light flares (WLF) a few decades ago. A WLF is any flare that becomes visible in white light (no H-alpha filter, no x-rays,...) against the background of the solar disk. Thus, such bright WLFs become only visible when extremely strong solar flares take place, and thus they are very rare. The first flare ever observed was such a rare WLF and observed by Richard Carrington while he was making his daily solar observations on 1 September 1859 (see the figures above). Other famous example involve the major solar flares of 28 October 2003 -as imaged by Thierry Legault- and of 14 December 2006 as imaged by the Hinode Solar Optical Telescope (NASA/JAXA). A study by Neidig and Cliver for the period 1859-1982 (1983) shows a diagram when these WLFs occur in the course of a solar cycle. The set-up of this diagram is similar to the one discussed earlier. The horizontal axis indicates the time in years with respect to the solar cycle maximum, while on the vertical axis is the total number of WLFs summed over the period 1859-1982. Sure enough, peaks at resp. 1 and 3 years after the year of solar cycle maximum are prominently present (see the chart underneath). All this means that for the next 1 to 2 years, we may still be in for occasional periods of very enhanced space weather conditions.