
A compilation of the most memorable space weather moments of 2020 can be found underneath. Using the versatile Space Weather JHelioviewer (SWHV) software, a ***MOVIE*** was created (available at YouTube and also at STCE (wmv - 432MB)) containing one or more clips of each event. Usually, SDO-images were used, occasionally supplemented with imagery from PROBA2, SOHO, STEREO, and GOES/SUVI.
As this chronological list concerns mostly punctual events on the Sun, it does not contain clips from other noteworthy events in 2020, such as e.g. the solar cycle minimum and onset of new solar cycle 25 (SC25) (SILSO, STCE), the launch of Solar Orbiter, the first light of and discoveries with SolO's Extreme Ultraviolet Imager (EUI), the fine appearance of comet NEOWISE, and good old SOHO's 25 years anniversary.
Happy viewing!
Event 1: 14-15 April - Stealth CME causes minor geomagnetic storm
During the afternoon and evening of 14 April, almost simultaneously, 2 coronal mass ejections (CMEs) became visible in STEREO-A and SOHO imagery, one each at their respective east and west solar limb. This meant that the latter CME was on the earth-facing side of the Sun (the "west" CME). In extreme ultraviolet (EUV) imagery taken by both satellites, no obvious on-disk source could be found for this slow, narrow and weak so-called stealth CME. Hence, expectations were low for the earth environment being hit. Nonetheless, early on 20 April, a shock was observed with solar wind speed jumping from 296 to 333 km/s. Bz, indicating the north- or southward orientation of the magnetic field, turned strongly southward (negative) reaching -15 nT (!) during a 4-hour period (07-11UT). This was the most negative excursion of Bz for the entire year. The subsequent evolution of the solar wind parameters was a clear indication of an interplanetary CME passing the earth environment, which most likely was the "west" CME from 14-15 April. Geomagnetic activity reached minor storming levels (Kp=5), and the Dst index reached -59 nT which was the lowest of the year (WDC Kyoto).
Ref: STCE news item of 28 April 2020
Event 2: 29 May - First M-class flare of the new SC25
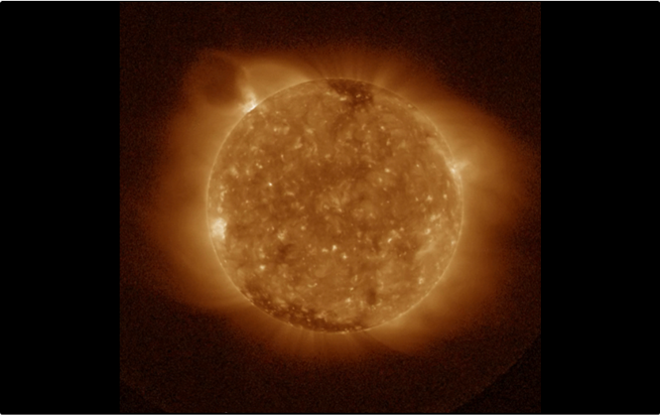
On 29 May, while still behind the northeast solar limb, an active region near +35 degrees latitude (so belonging to the new solar cycle) shifted its activity into a higher gear producing an M1.1 flare at 07:24UT and a C9.3 flare near 10:46UT. This was the first M-class event since 20 October 2017, and thus also of the freshly started SC25. The STEREO-A/EUVI imagers revealed EIT waves moving mainly to the south. The eruptions were associated with some weak radio-bursts, as detected by the radioastronomy station in Humain. Not only the strength of the two flaring events were very similar, also the outlook of both eruptions was a close match. Images by the SUVI instrument (Solar Ultraviolet Imager) onboard the GOES-16 satellite showed that both events started out as the typical balloon-like eruption billowing away from the Sun. The imagery then clearly shows how the northern part seems to bump into the fanning, overarching magnetic field of the Sun's northern polar coronal hole, getting deflected towards the east ("left") as if it had hit a brick wall. Consequently also the resulting CMEs had a very similar (and very distorted) outlook.
When the likely source region (NOAA 2764) had finally rotated over the east limb, only a very small spot was remaining, barely visible even in larger telescopes
Ref: STCE news item of 2 June 2020
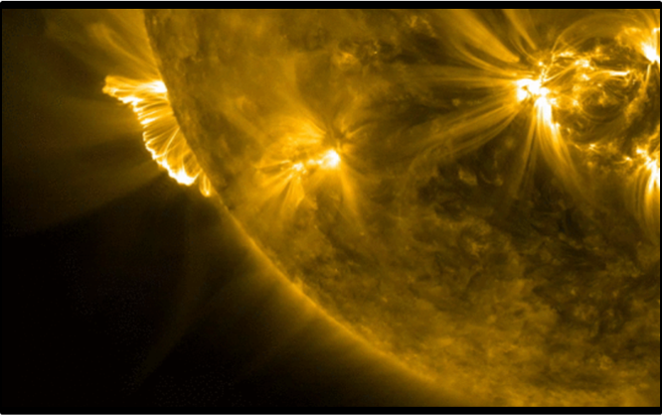
Event 3: 31 August - Filament eruption
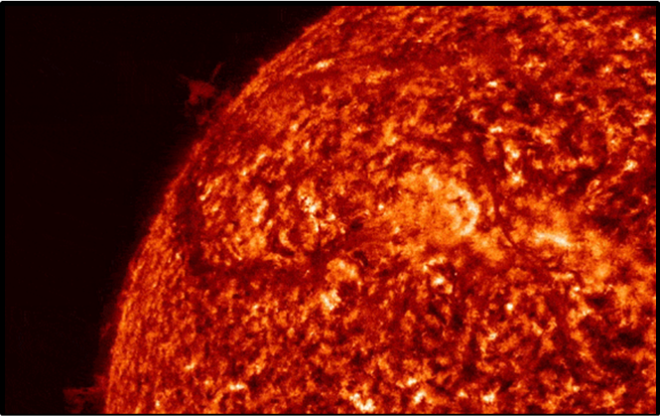
Solar filaments are clouds of charged particles ("plasma") above the solar surface squeezed between magnetic regions of opposite polarity. Being cooler and denser than the plasma underneath and their surroundings, they appear as dark lines when seen on the solar disk and as bright blobs when seen near the solar limb (then they are called "prominences"). Long filaments are known to eventually erupt, as the surrounding magnetic fields usually become unstable at some point. Early on 31 August however, magnetic fields around a relatively small filament chunck became unstable, resulting in the eruption of the short filament. No significant x-ray flaring was associated with this event. A weak non-earth directed CME was observed. Some of the material rained back to the solar surface along the magnetic field lines. The eruption was well covered by SDO and STEREO-A imagery, and in particular the images at lower temperatures of about 80.000 degrees (filter passband of 30.4 nm ) showing the filament and the ejected loop-like structure of cold plasma were quite spectacular.
Ref: STCE news item of 7 September 2020
Event 4: 24 September - 2 October - Coronal hole windstream speed > 500 km/s
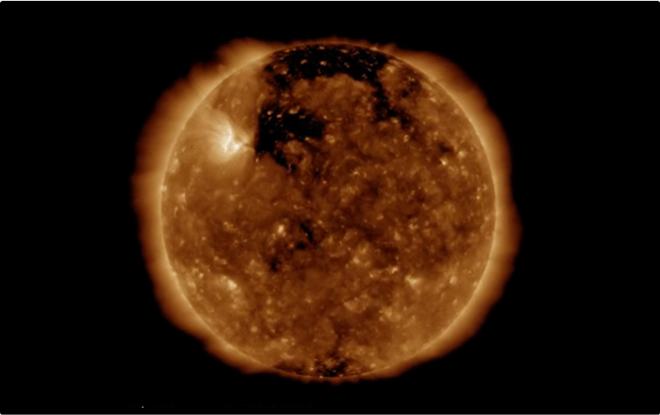
Geomagnetic activity reached moderate storming conditions late September following the arrival of enhanced wind streams related to an extension from the northern positive polarity polar coronal hole. The geomagnetic storm continued already elevated levels of geomagnetic activity that started on 24 September following the arrival of high speed wind streams associated with other extensions from the northern polar coronal hole. Kp-wise, this was the strongest geomagnetic storming period of the year. Solar wind speed gradually increased from values near 360 km/s on 23 September to values peaking around 675 km/s on 29 September (DSCOVR), and was above 500 km/s from 24 September till 2 October. These persistent high speed wind streams were also the source of elevated levels of energetic (energies of more than 2 MeV) electrons with daily maxima above the alert threshold of 1000 pfu (particle flux units; 1 pfu = 1 electron / cm2 s sr) from 24 September onwards as measured by the GOES satellites. A maximum flux of more than 42.000 pfu was reached on 5 October, and the daily electron fluence was at high levels during this period. High levels of these electrons can lead to electrostatic discharges (ESD) resulting in malfunctions of a satellite and occasionally even in the satellite failure. Even after the solar wind speed has decreased to nominal values, high levels of energetic electrons can still persist for several days.
Ref: STCE news item of 29 September 2020
Event 5: 23 October - 7 December - Increased sunspot activity
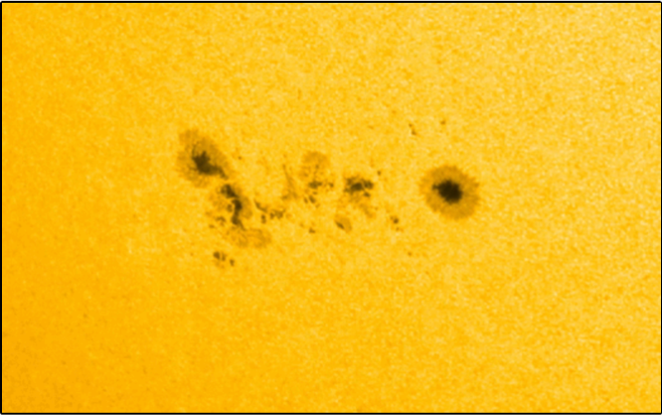
The last 3 months of 2020 saw an increase in number and size of the sunspot groups. Active region NOAA 2778 developed quickly into a relatively large group on 25 October, and was joined on 28 October by a region to its northeast. This NOAA 2779 showed some complex sunspot structures, but remained smaller than its big brother. Both regions produced several low-level C-class flares, but no obvious CMEs were associated with these flaring events. NOAA 2781 rotated into view on 2 November, quickly increasing in size. At its maximum on 6 November, its sunspot area had the equivalent of nearly 3 times the surface area of the Earth (NOAA), and it was reported a naked eye sunspot (seen thru eclipse glasses) by several solar observers worldwide. The strongest flares produced by this region were a C7 flare early on 5 November and a C5 event on 8 November. Then during the last days of November, several sunspot groups became visible driving the International Sunspot Number (ISN) to the highest in 2020. On 29 November, there were no less than 6 groups present at the same time, with the ISN reaching 96, a value not seen since the last episode of major solar activity back in September 2017. The main sunspot group was NOAA 2786, of which the largest spot was reported visible to the naked eye. On top of that, according to the daily USAF/NOAA Solar Region Summaries (SRS), NOAA 2786 was also the first group of solar cycle 25 (SC25) to reach an area of 1000 MH. Note that 1000 MH ("millionths of a solar hemisphere") correspond to roughly 6 times the entire surface of the Earth. The presence of so many sunspots also drove the observed 10.7cm solar radio flux above the 100 sfu (solar flux units, with 1 sfu = 10-22 W m-2 Hz-1) level, for the first time this solar cycle. It reached a maximum value of 116.3 sfu on 29 November, again values not seen in more than 3 years. Despite their size, these regions had relatively simple magnetic configurations and produced only C-class flares.
Ref: STCE news items of 3 November 2020, 10 November 2020, and 1 December 2020
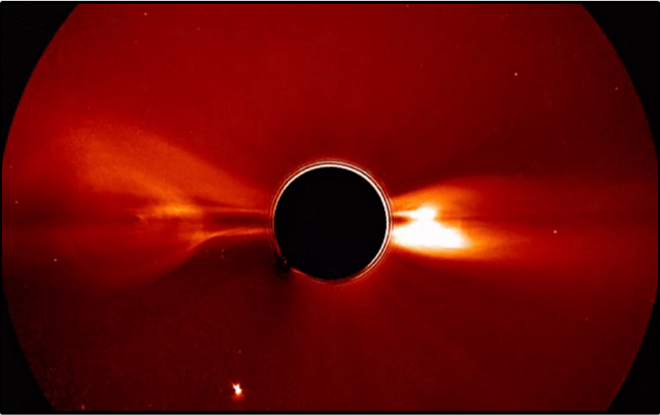
Event 6: 29 November - Strongest solar flare of the year
On 29 November, a strong long duration M4.4 flare was produced by a region that was still behind the southeast limb. Despite its location, post-flare coronal loops quickly towered a considerable 65.000 km above the solar limb. The associated CME was the fastest so far this solar cycle, with a speed of around 1250 km/s. Interestingly, based on STEREO-A data, the very same region was also the source of the first halo CME of SC25. On 24 November, an asymmetric halo was recorded around the Sun in coronagraphic imagery by the SOHO/LASCO instrument The all-in-all faint CME originated from a source on the farside of the Sun ans so it was not directed to Earth. NOAA 2790, the most likely source of thesde events, was an all-in-all relatively simple and decaying active region consisting mainly of a single sunspot.
Ref: STCE news item of 1 December 2020
Event 7: 5-6 December - NOAA 2790 bears a flare triplet
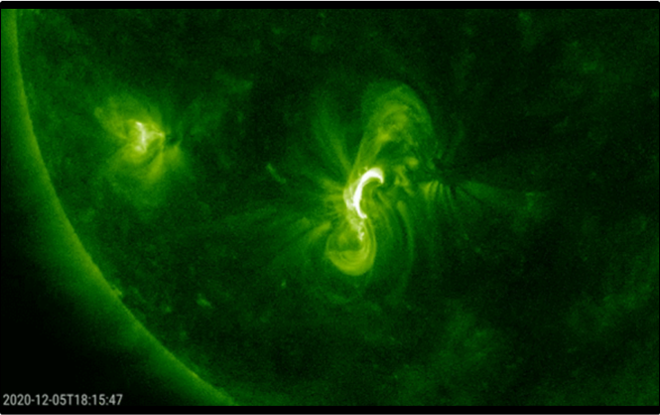
Despite being a relatively small sunspot region, NOAA 2790 continued to surprize with a series of low-level but complex flaring events. They concern homologuous flares, i.e. a series of solar flares repeating in the same active region with essentially the same position and with a common pattern of development, i.e. having the same main footpoints and general shape in the main phase as defined in H-alpha or EUV-imagery. Though not a requirement, homologous flares often have similar strength, and if there are more than two, they sometimes occur within similar time intervals. NOAA 2790 produced several low-level C-class flares such as e.g. on 5 and 6 December which were of similar strength (resp. C1.6, C1.2 and C1.6) and happening at intervals around 18 hours between each other. More importantly, extreme ultraviolet (EUV) imagery by SDO revealed an almost identical flare outlook, i.e. a stretched S-shape with a significant brighter northern portion and a somewhat fuzzy area just north of the active region. Despite the quite dynamical character of the flaring events, none of them were associated with a coronal mass ejection.
Ref: STCE news item of 7 December 2020
Event 8: 7 December - Spectacular long duration event
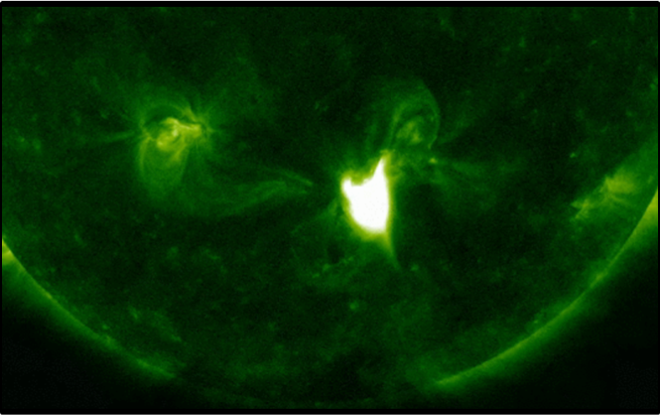
NOAA 2790 produced a long duration C7.4 flare peaking on 7 December at 16:32 UT. The flare lasted for 107 minutes and produced relatively strong bursts on various radio wavelengths. The 10.7 cm radio flux doubled in value making the event a tenflare. SDO's extreme ultraviolet imagery (EUV) showed that the eruption took place in the same "S-shaped" area as the previous flares, however the magnetic configuration was such that it allowed for a full magnetic reconnection. It also showed a candle-flame like structure visible in AIA 094 filter. This is called a cusp and is indicative of the magnetic reconnection that took place and that it was associated with a CME. Coronagraphic imagery from SOHO revealed indeed a full halo CME with an estimated speed of around 1250 km/s. A shock was seen in the solar wind on 10 December at 01:34 UT marking the arrival of the CME from 7 December. The speed jumped from 450 km/s to 560 km/s, however this interplanetary CME did not possess long lasting negative Bz, thus resulting in only unsettled to active geomagnetic conditions.
Ref: STCE news item of 8 December 2020
